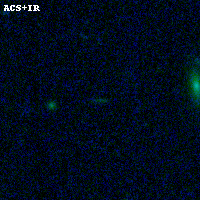
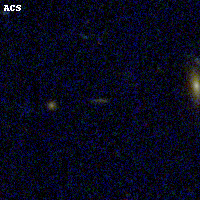
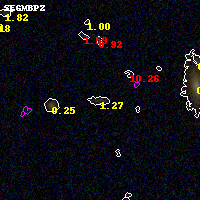
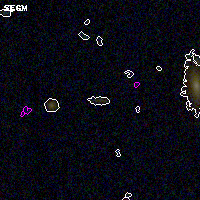
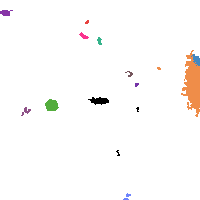
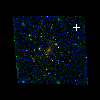
RXC0142+44 ACS+IR detection object #1019
Color images and BPZ results
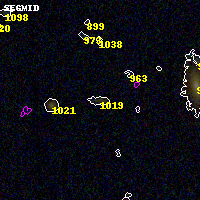
Catalog: 1019.cat
Black segments are analyzed here. Roll mouse over color images to view segments.
Best viewed in a wide browser window (1200 pixels or more). Download SED & P(z) plots to view larger versions.
In P(z) plots: Yellow lines mark the cluster redshift z = 0.341,
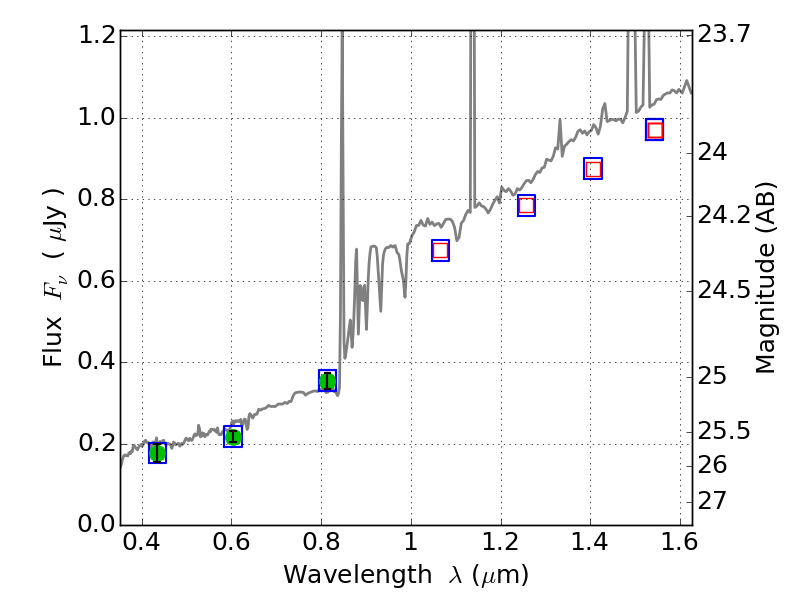
Object #1019 x,y = (3834, 3656) RA, Dec = (01:42:47.304, 44:39:12.60) = (25.69710, 44.65350) BPZ = 1.274 [0.530--2.122] type = 8.10 (SB1_B10 - SB2_B10) chisq2 = 0.00 ODDS = 0.15 z_cluster = 0.341