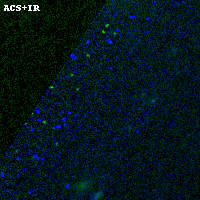
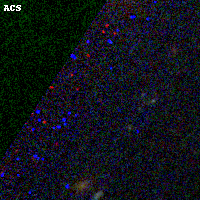
RXC0032+18 ACS+IR detection object #561
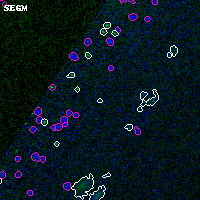
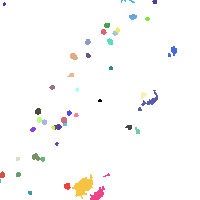
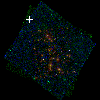
Color images and BPZ results
Catalog: 561.cat
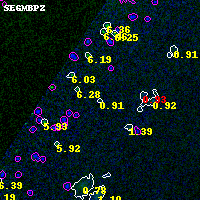
Black segments are analyzed here. Roll mouse over color images to view segments.
Best viewed in a wide browser window (1200 pixels or more). Download SED & P(z) plots to view larger versions.
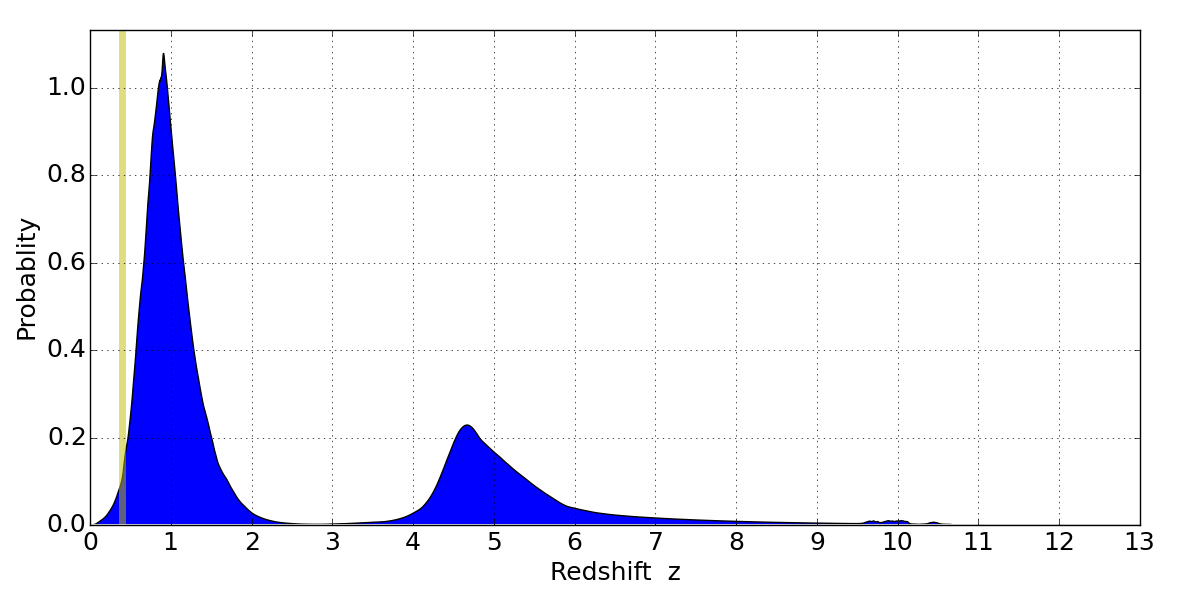
In P(z) plots: Yellow lines mark the cluster redshift z = 0.396,
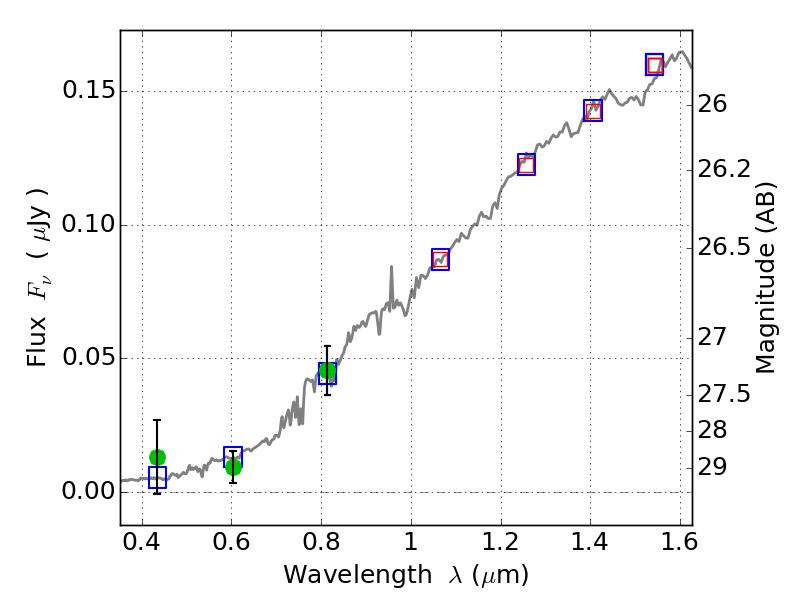
Object #561 x,y = (1464, 4056) RA, Dec = (00:32:15.624, 18:09:26.28) = (8.06510, 18.15730) BPZ = 0.911 [0.477--7.059] type = 6.00 (Sbc_B10) chisq2 = 0.30 ODDS = 0.16 z_cluster = 0.396