RXC0032+18 ACS+IR detection object #5019
Color images and BPZ results
Catalog: 5019.cat
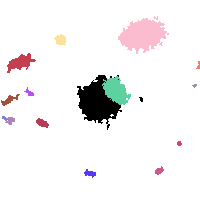
Black segments are analyzed here. Roll mouse over color images to view segments.
Best viewed in a wide browser window (1200 pixels or more). Download SED & P(z) plots to view larger versions.
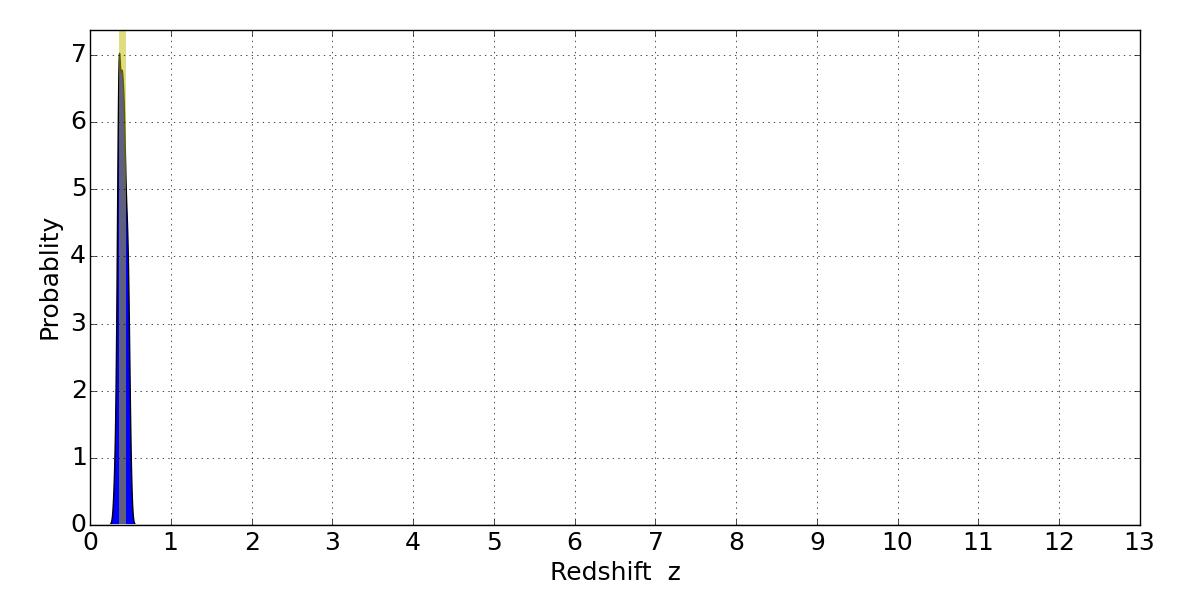
In P(z) plots: Yellow lines mark the cluster redshift z = 0.396,
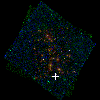
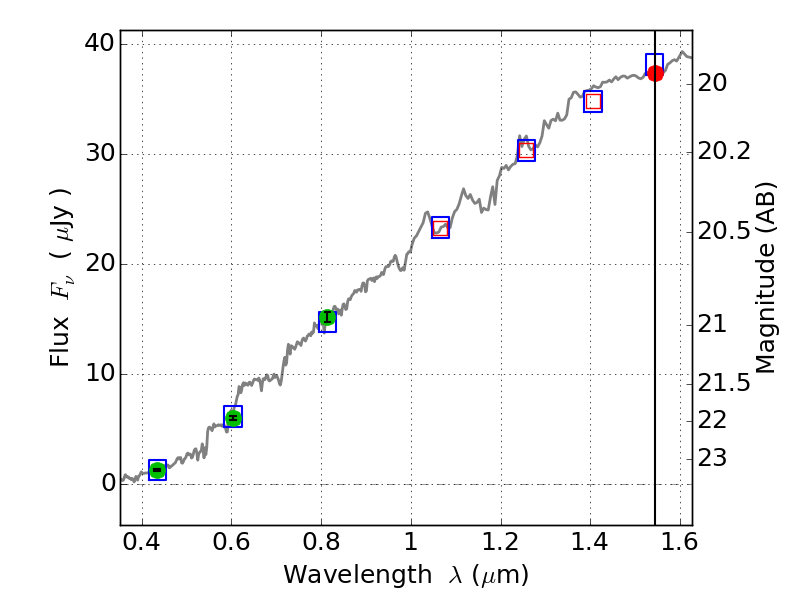
Object #5019 x,y = (2752, 1232) RA, Dec = (00:32:10.200, 18:06:36.72) = (8.04250, 18.11020) BPZ = 0.367 [0.315--0.502] type = 5.20 (ES0_B10 - Sbc_B10) chisq2 = 0.03 ODDS = 0.61 z_cluster = 0.396