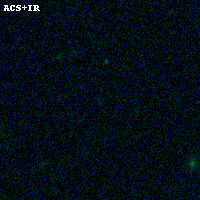
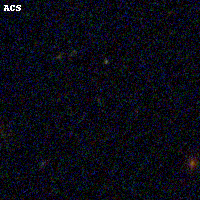
RXC0032+18 ACS+IR detection object #4010
Color images and BPZ results
Catalog: 4010.cat
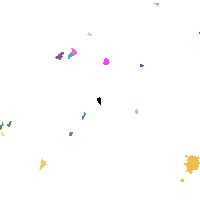
Black segments are analyzed here. Roll mouse over color images to view segments.
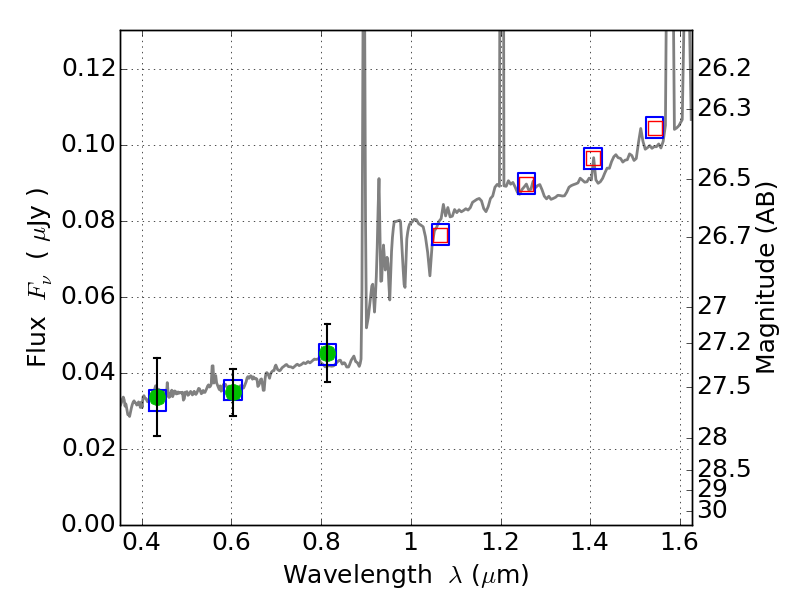
Best viewed in a wide browser window (1200 pixels or more). Download SED & P(z) plots to view larger versions.
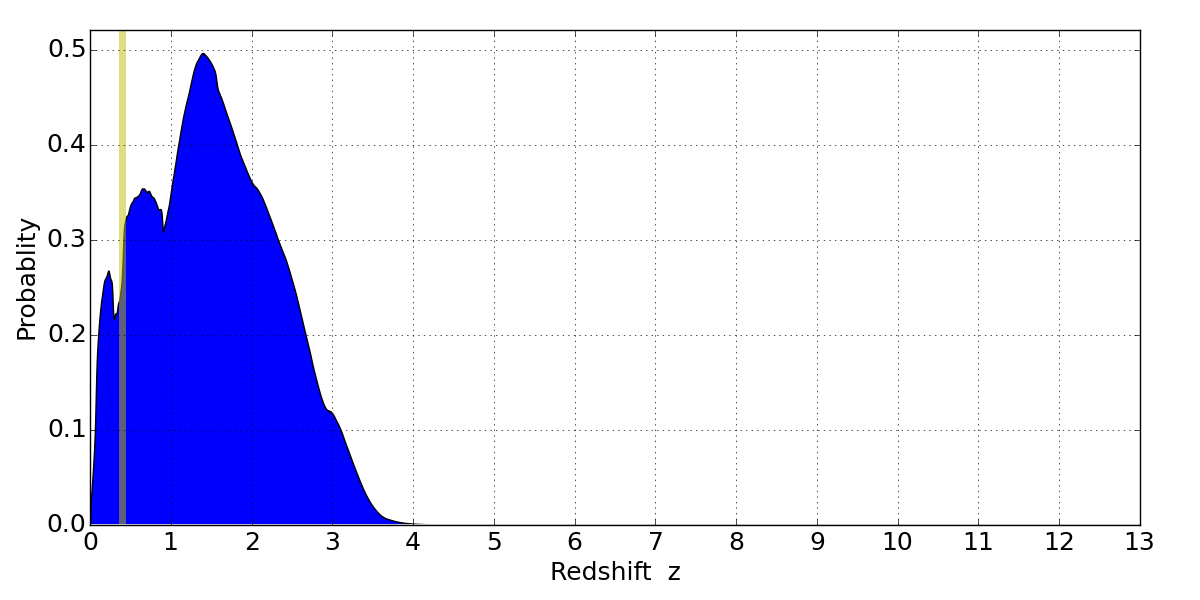
In P(z) plots: Yellow lines mark the cluster redshift z = 0.396,
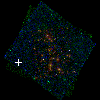
Object #4010 x,y = (946, 1929) RA, Dec = (00:32:17.808, 18:07:18.48) = (8.07420, 18.12180) BPZ = 1.401 [0.174--3.111] type = 9.10 (SB2_B10 - SB3_B10) chisq2 = 0.01 ODDS = 0.10 z_cluster = 0.396