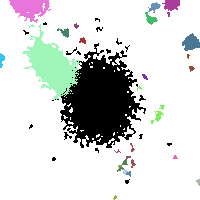
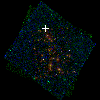
RXC0032+18 ACS+IR detection object #1012
Color images and BPZ results
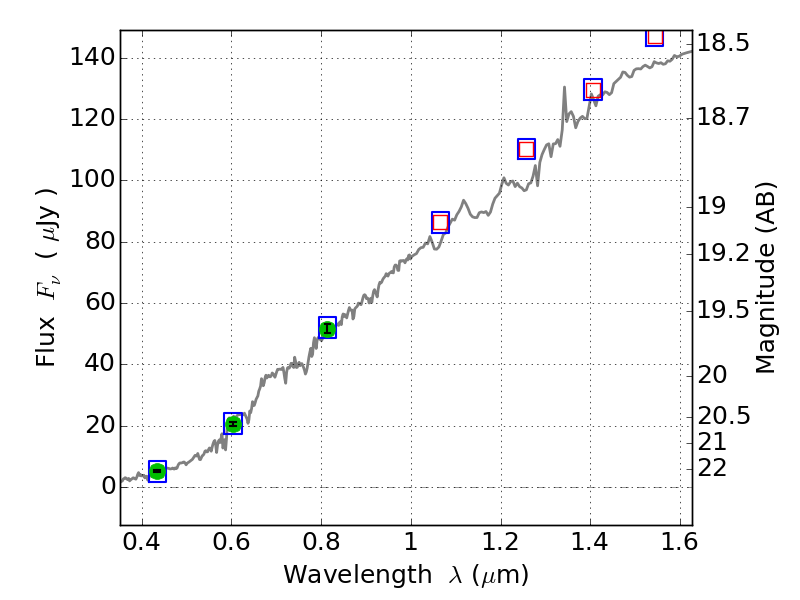
Catalog: 1012.cat
Black segments are analyzed here. Roll mouse over color images to view segments.
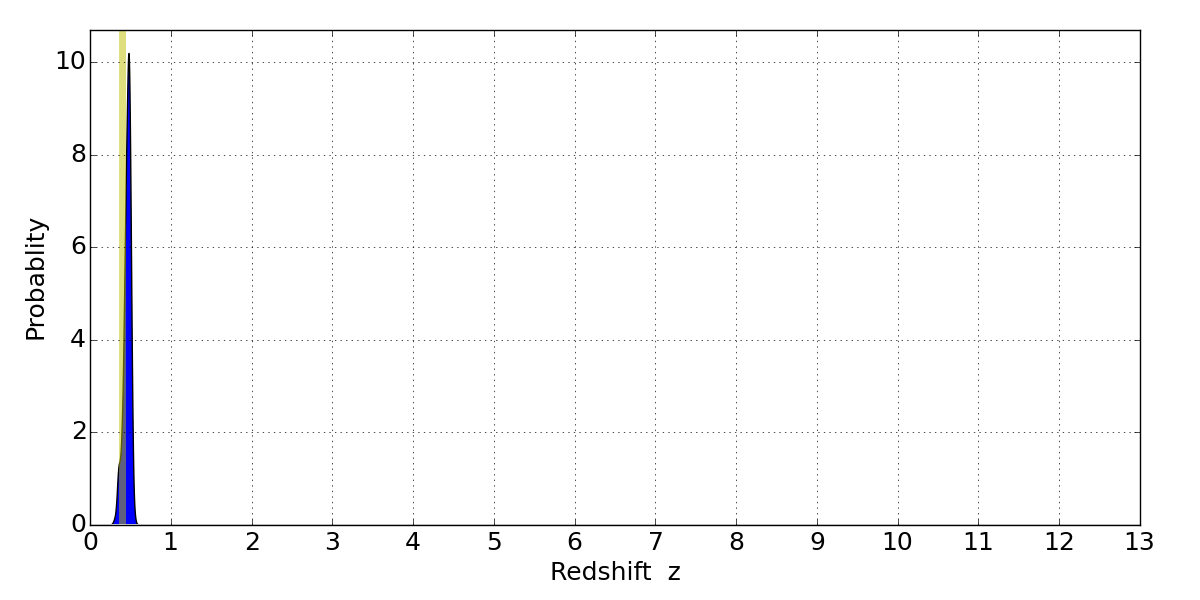
Best viewed in a wide browser window (1200 pixels or more). Download SED & P(z) plots to view larger versions.
In P(z) plots: Yellow lines mark the cluster redshift z = 0.396,
Object #1012 x,y = (2283, 3638) RA, Dec = (00:32:12.168, 18:09:01.08) = (8.05070, 18.15030) BPZ = 0.482 [0.350--0.535] type = 5.60 (Sbc_B10 - ES0_B10) chisq2 = 0.00 ODDS = 0.82 z_cluster = 0.396