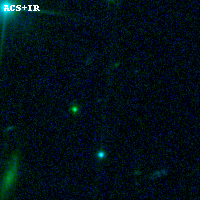
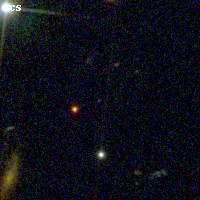
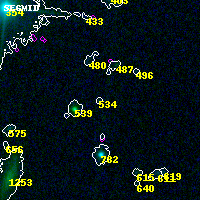
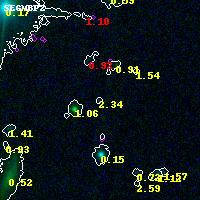
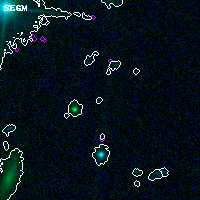
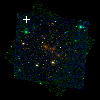
PLCKG308-20 ACS+IR detection object #534
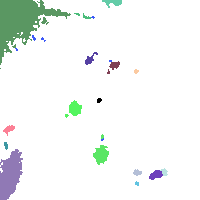
Color images and BPZ results
Catalog: 534.cat
Black segments are analyzed here. Roll mouse over color images to view segments.
Best viewed in a wide browser window (1200 pixels or more). Download SED & P(z) plots to view larger versions.
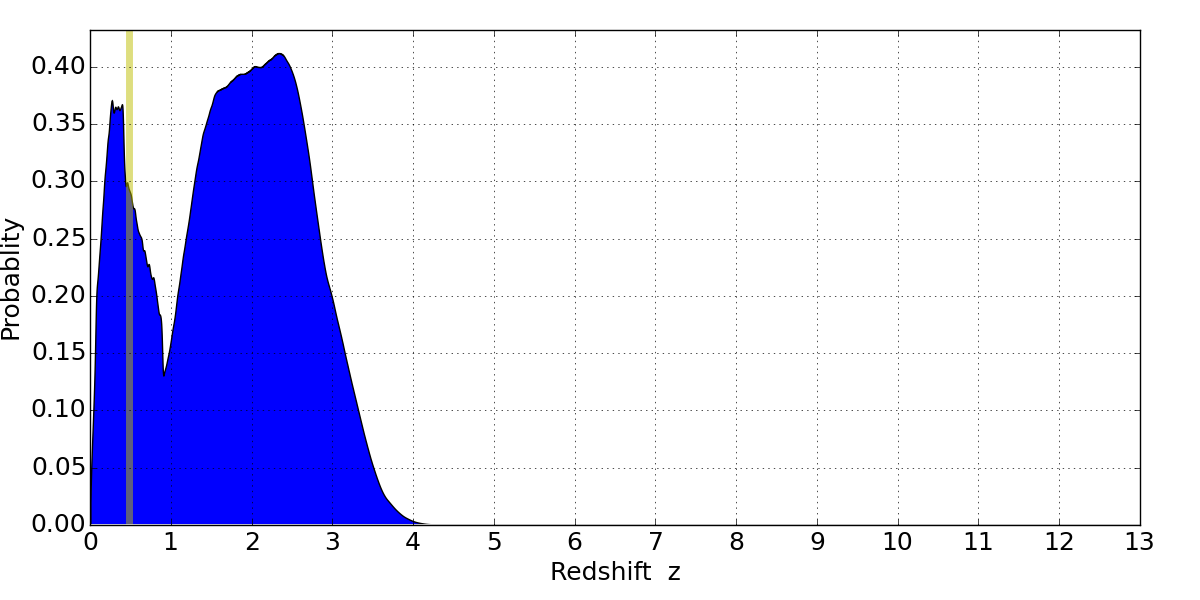
In P(z) plots: Yellow lines mark the cluster redshift z = 0.480,
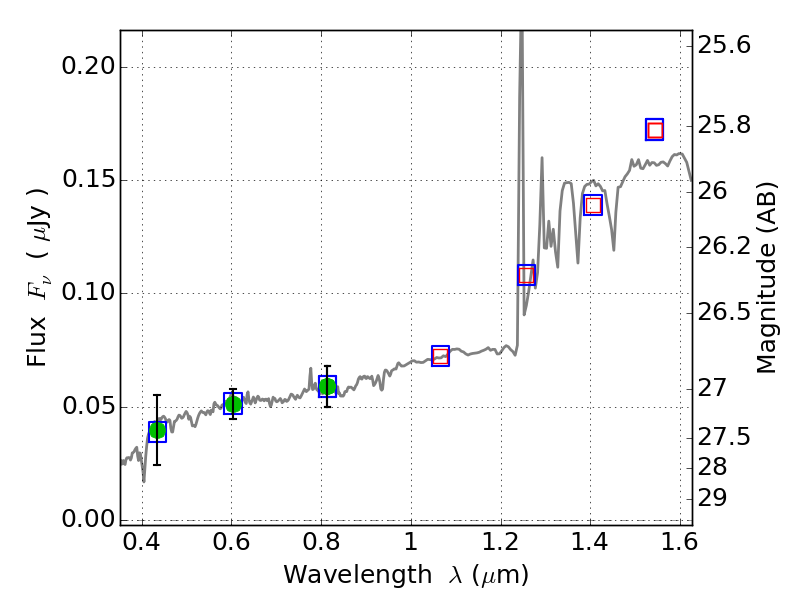
Object #534 x,y = (1349, 4092) RA, Dec = (15:19:19.536, -81:28:59.16) = (229.83140, -81.48310) BPZ = 2.344 [0.157--3.309] type = 8.60 (SB2_B10 - SB1_B10) chisq2 = 0.00 ODDS = 0.11 z_cluster = 0.480