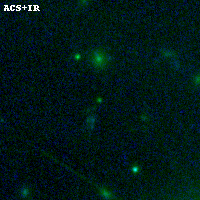
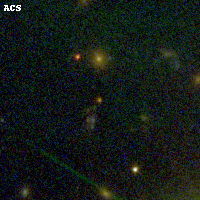
PLCKG308-20 ACS+IR detection object #1283
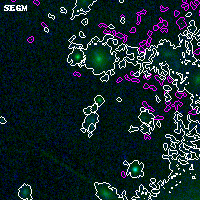
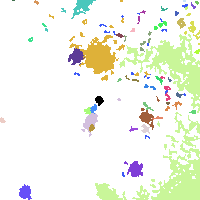
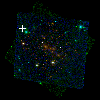
Color images and BPZ results
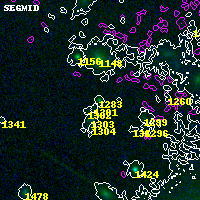
Catalog: 1283.cat
Black segments are analyzed here. Roll mouse over color images to view segments.
Best viewed in a wide browser window (1200 pixels or more). Download SED & P(z) plots to view larger versions.
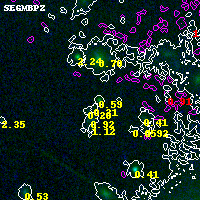
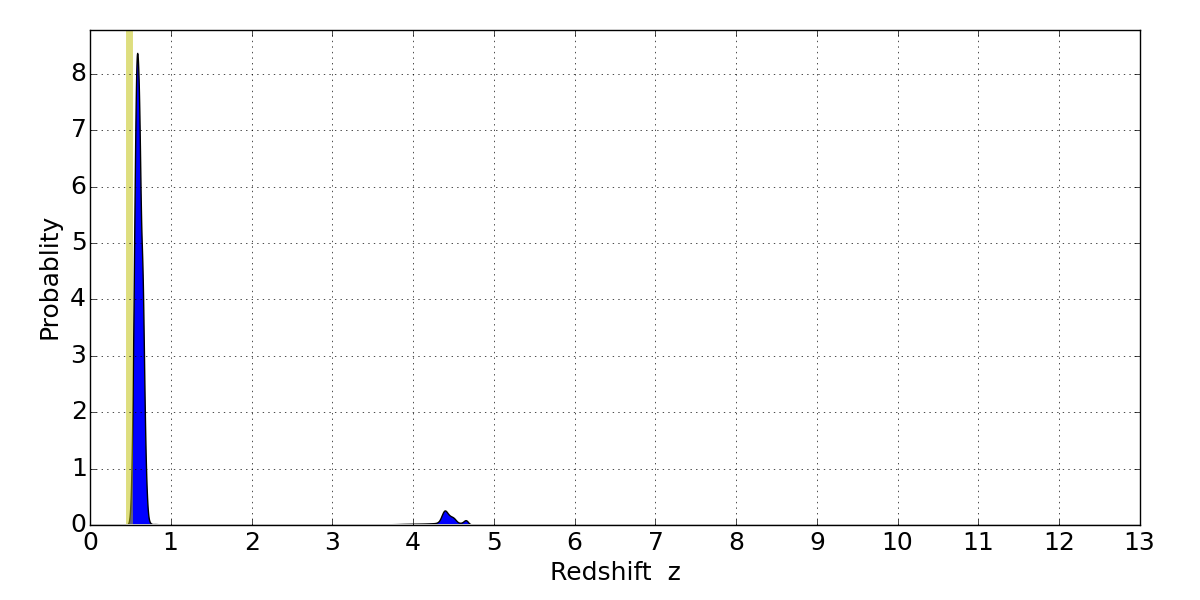
In P(z) plots: Yellow lines mark the cluster redshift z = 0.480,
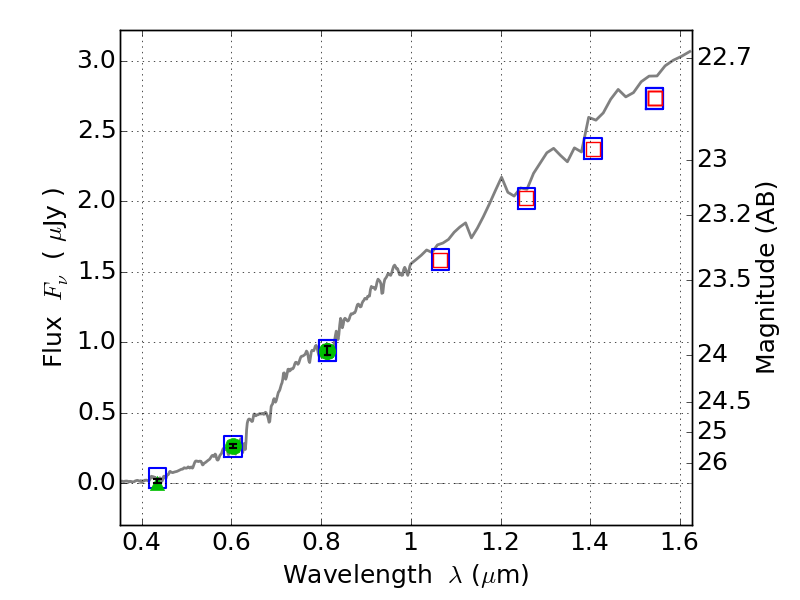
Object #1283 x,y = (1124, 3611) RA, Dec = (15:19:25.632, -81:29:28.32) = (229.85680, -81.49120) BPZ = 0.591 [0.528--4.424] type = 2.60 (Ell5_A_0 - Ell6_A_0) chisq2 = 0.04 ODDS = 0.79 z_cluster = 0.480