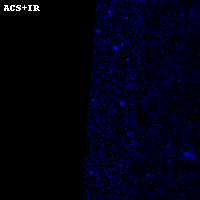
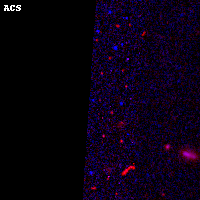
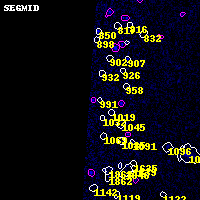
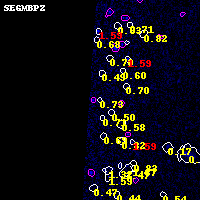
PLCKG308-20 ACS+IR detection object #991
Color images and BPZ results
Catalog: 991.cat
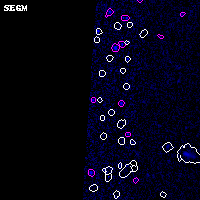
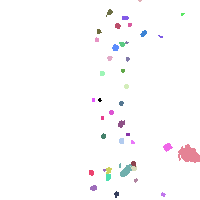
Black segments are analyzed here. Roll mouse over color images to view segments.
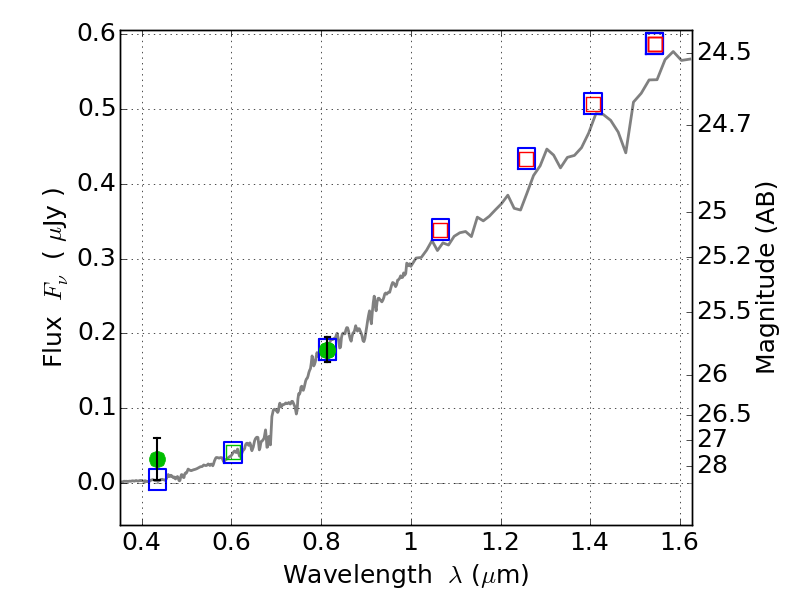
Best viewed in a wide browser window (1200 pixels or more). Download SED & P(z) plots to view larger versions.
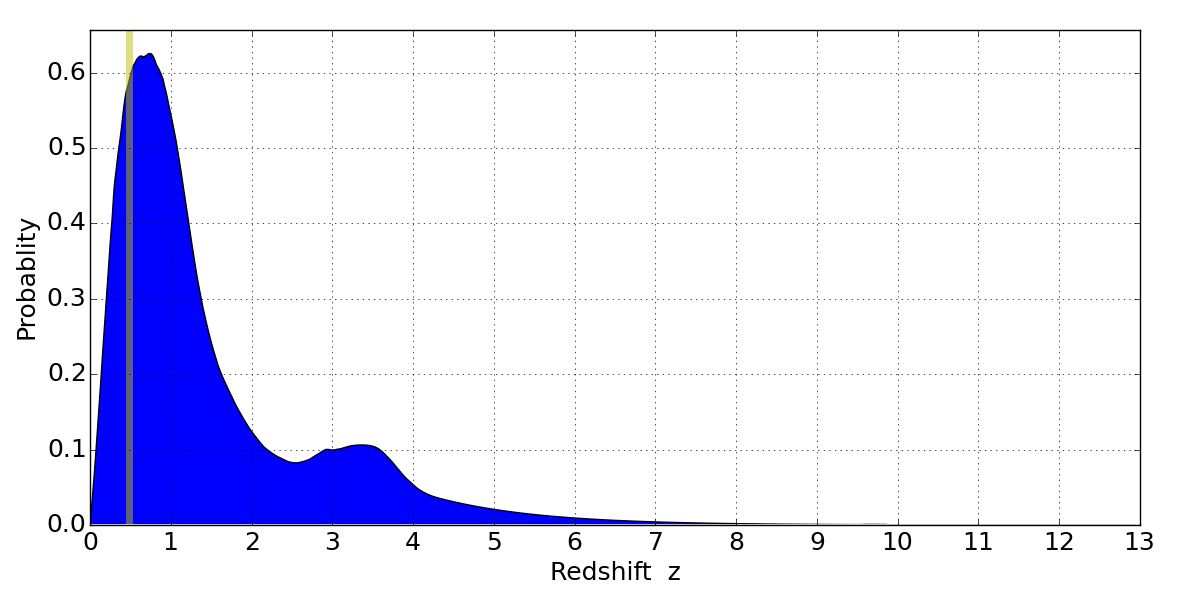
In P(z) plots: Yellow lines mark the cluster redshift z = 0.480,
Object #991 x,y = (827, 3811) RA, Dec = (15:19:33.672, -81:29:16.08) = (229.89030, -81.48780) BPZ = 0.734 [0.188--5.016] type = 3.00 (Ell5_A_0) chisq2 = 0.32 ODDS = 0.09 z_cluster = 0.480