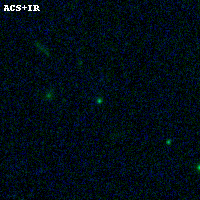
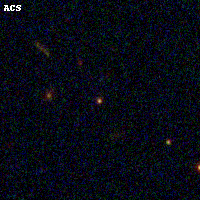
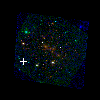
PLCKG308-20 ACS+IR detection object #5020
Color images and BPZ results
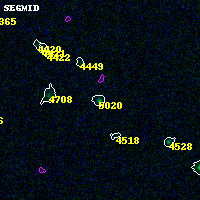
Catalog: 5020.cat
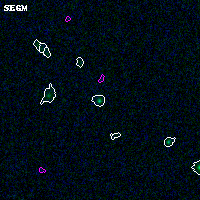
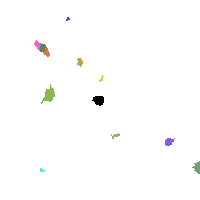
Black segments are analyzed here. Roll mouse over color images to view segments.
Best viewed in a wide browser window (1200 pixels or more). Download SED & P(z) plots to view larger versions.
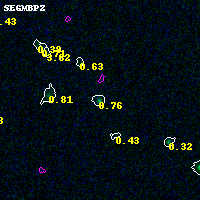
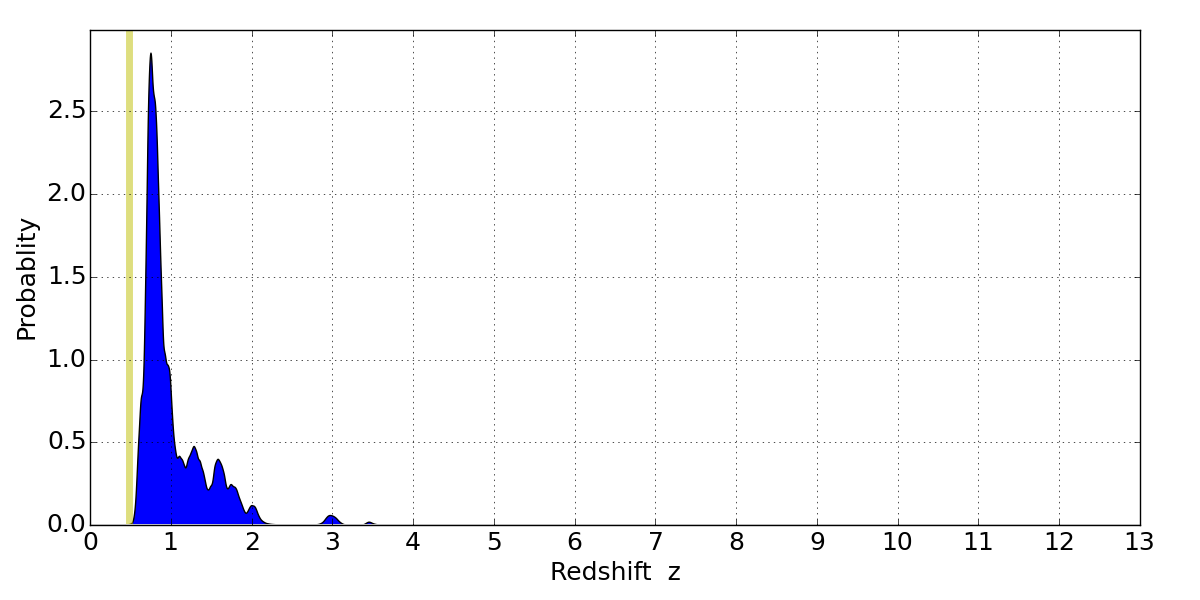
In P(z) plots: Yellow lines mark the cluster redshift z = 0.480,
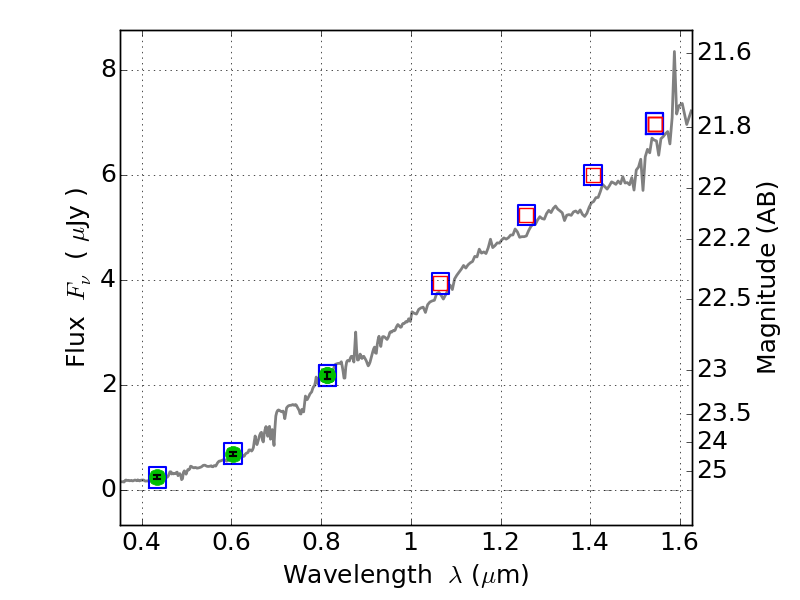
Object #5020 x,y = (1192, 1951) RA, Dec = (15:19:23.904, -81:31:07.68) = (229.84960, -81.51880) BPZ = 0.755 [0.620--1.988] type = 6.00 (Sbc_B10) chisq2 = 0.00 ODDS = 0.35 z_cluster = 0.480