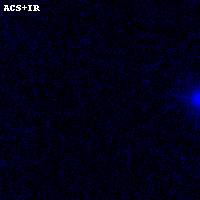
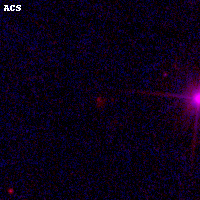
PLCKG308-20 ACS+IR detection object #416
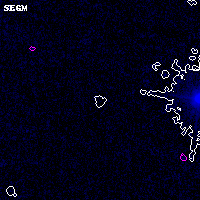
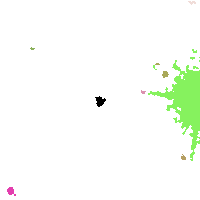
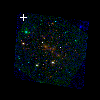
Color images and BPZ results
Catalog: 416.cat
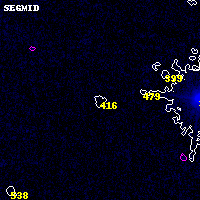
Black segments are analyzed here. Roll mouse over color images to view segments.
Best viewed in a wide browser window (1200 pixels or more). Download SED & P(z) plots to view larger versions.
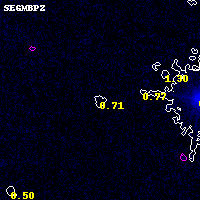
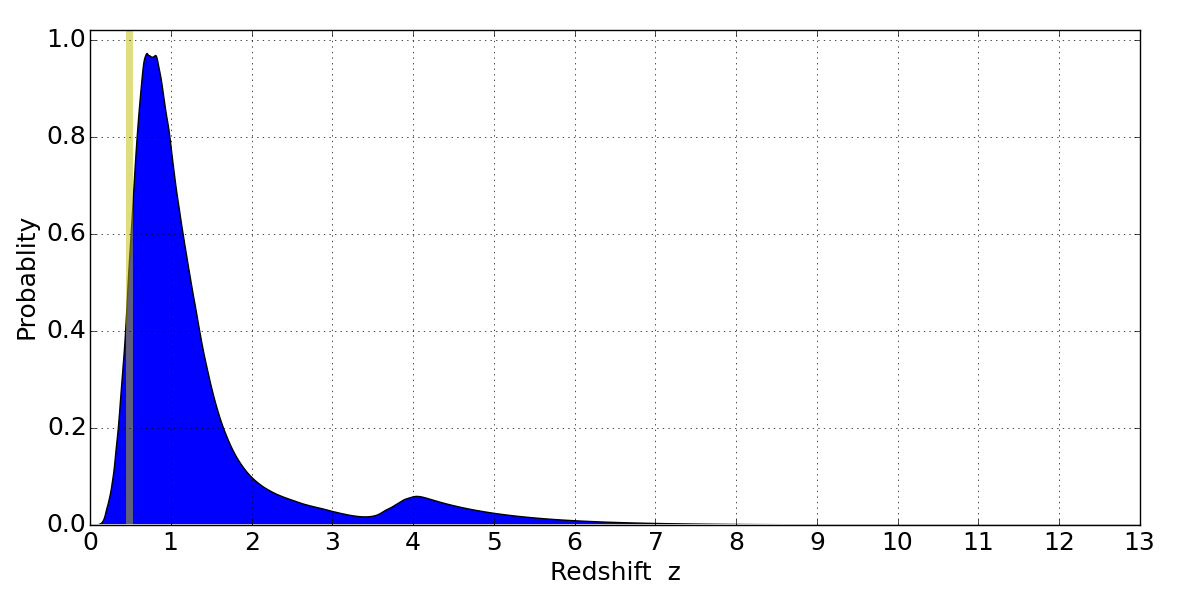
In P(z) plots: Yellow lines mark the cluster redshift z = 0.480,
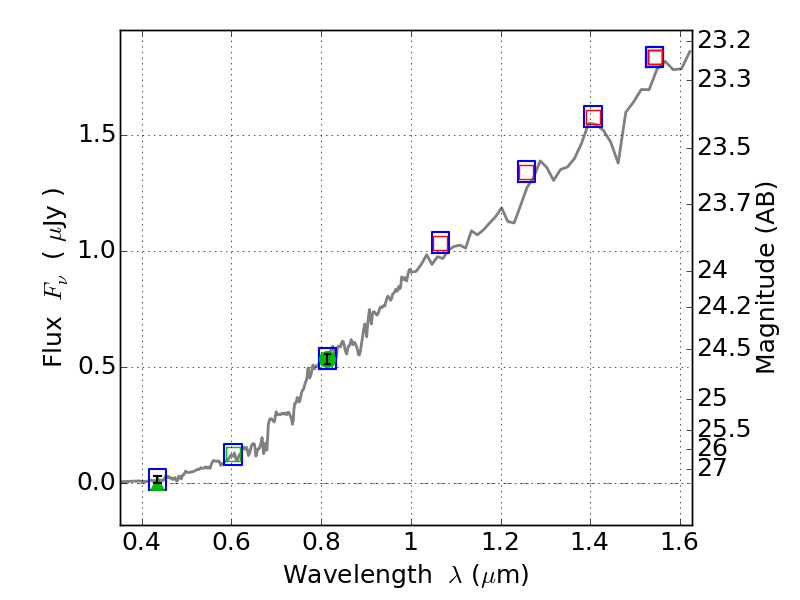
Object #416 x,y = (1157, 4182) RA, Dec = (15:19:24.720, -81:28:53.76) = (229.85300, -81.48160) BPZ = 0.706 [0.389--4.947] type = 2.00 (Ell6_A_0) chisq2 = 0.01 ODDS = 0.13 z_cluster = 0.480