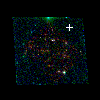
PLCKG209+10 ACS+IR detection object #875
Color images and BPZ results
Catalog: 875.cat
Black segments are analyzed here. Roll mouse over color images to view segments.
Best viewed in a wide browser window (1200 pixels or more). Download SED & P(z) plots to view larger versions.
In P(z) plots: Yellow lines mark the cluster redshift z = 0.677,
Object #875 x,y = (3491, 3668) RA, Dec = (07:22:19.200, 07:25:42.24) = (110.58000, 7.42840) BPZ = 0.366 [0.240--3.266] type = 3.00 (Ell5_A_0) chisq2 = 0.00 ODDS = 0.41 z_cluster = 0.677