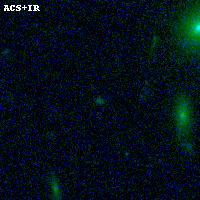
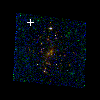
PLCKG171-40 ACS+IR detection object #411
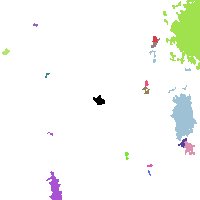
Color images and BPZ results
Catalog: 411.cat
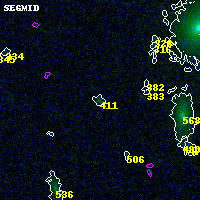
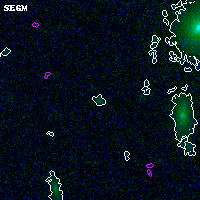
Black segments are analyzed here. Roll mouse over color images to view segments.
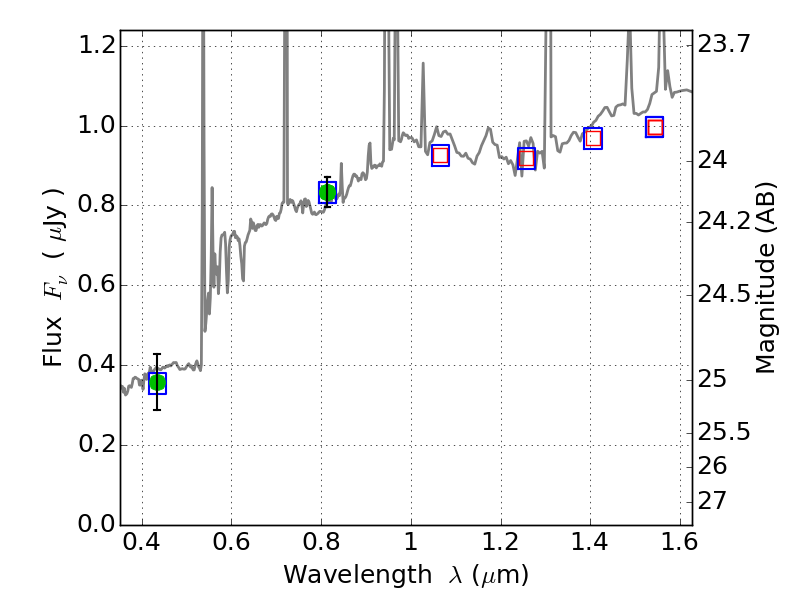
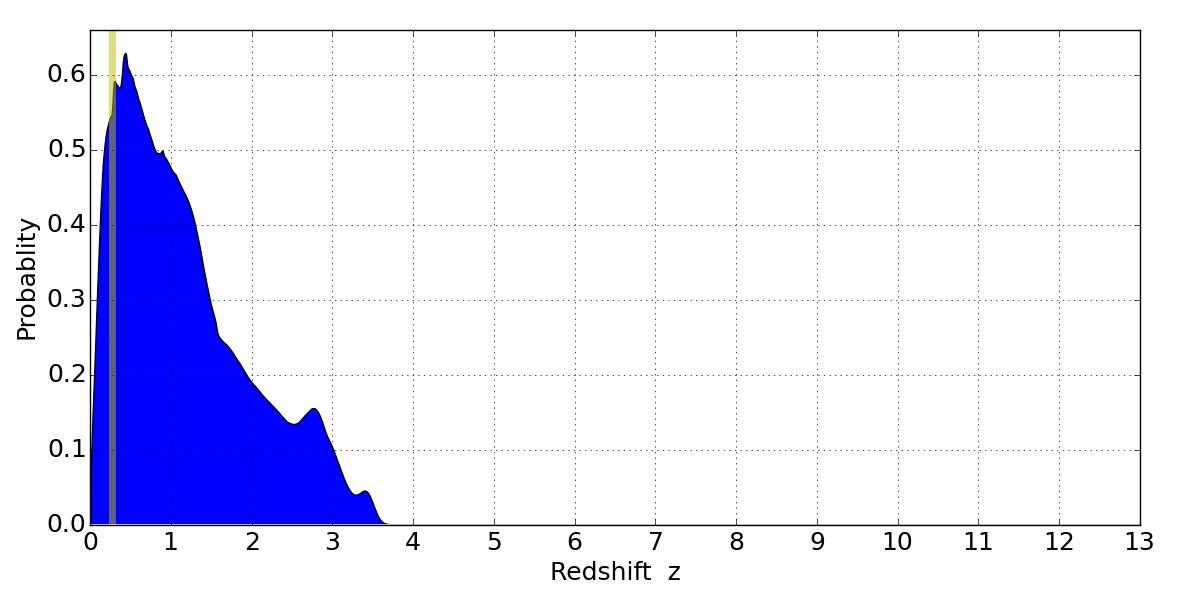
Best viewed in a wide browser window (1200 pixels or more). Download SED & P(z) plots to view larger versions.
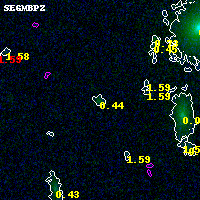
In P(z) plots: Yellow lines mark the cluster redshift z = 0.270,
Object #411 x,y = (1534, 3922) RA, Dec = (03:13:01.008, 08:23:46.32) = (48.25420, 8.39620) BPZ = 0.443 [0.121--3.049] type = 9.20 (SB2_B10 - SB3_B10) chisq2 = 0.00 ODDS = 0.07 z_cluster = 0.270