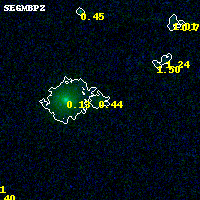
PLCKG171-40 ACS+IR detection object #1091
Color images and BPZ results
Catalog: 1091.cat
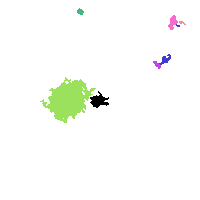
Black segments are analyzed here. Roll mouse over color images to view segments.
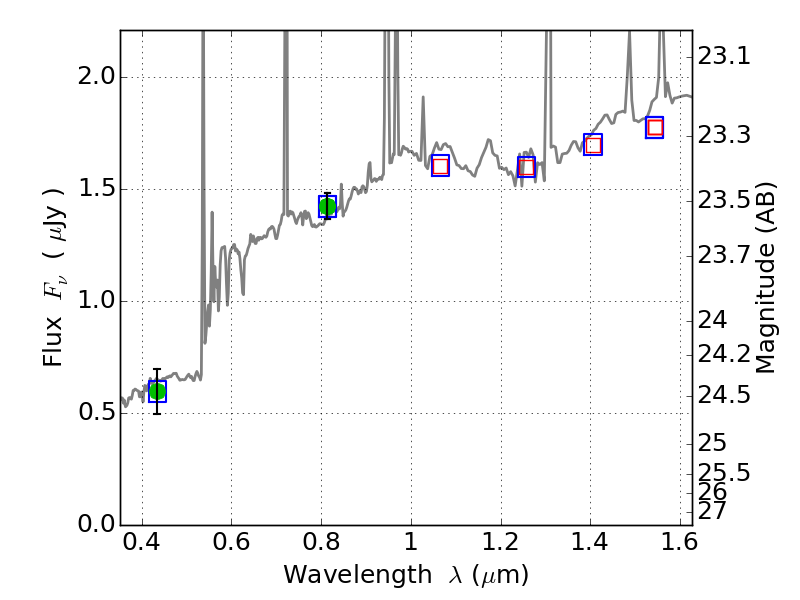
Best viewed in a wide browser window (1200 pixels or more). Download SED & P(z) plots to view larger versions.
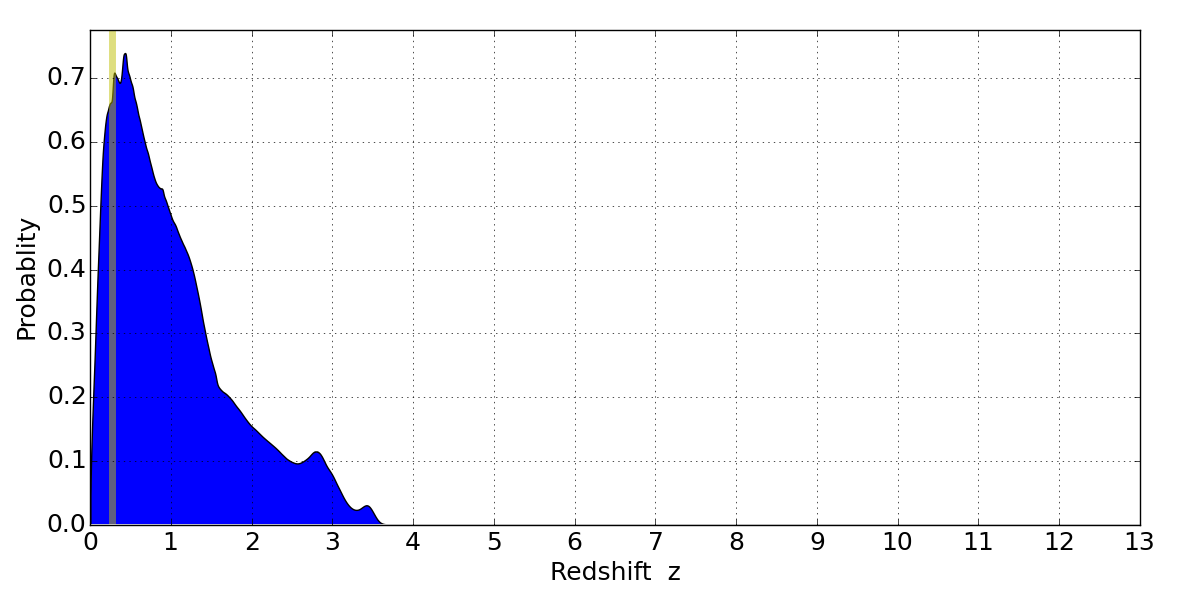
In P(z) plots: Yellow lines mark the cluster redshift z = 0.270,
Object #1091 x,y = (4057, 3443) RA, Dec = (03:12:50.808, 08:23:17.52) = (48.21170, 8.38820) BPZ = 0.440 [0.110--2.940] type = 9.10 (SB2_B10 - SB3_B10) chisq2 = 0.00 ODDS = 0.08 z_cluster = 0.270