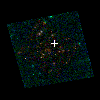
PLCKG138-10 IR detection object #403
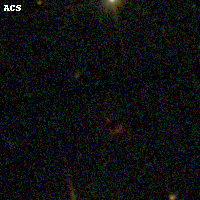
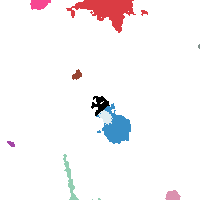
Color images and BPZ results
Catalog: 403.cat
Black segments are analyzed here. Roll mouse over color images to view segments.
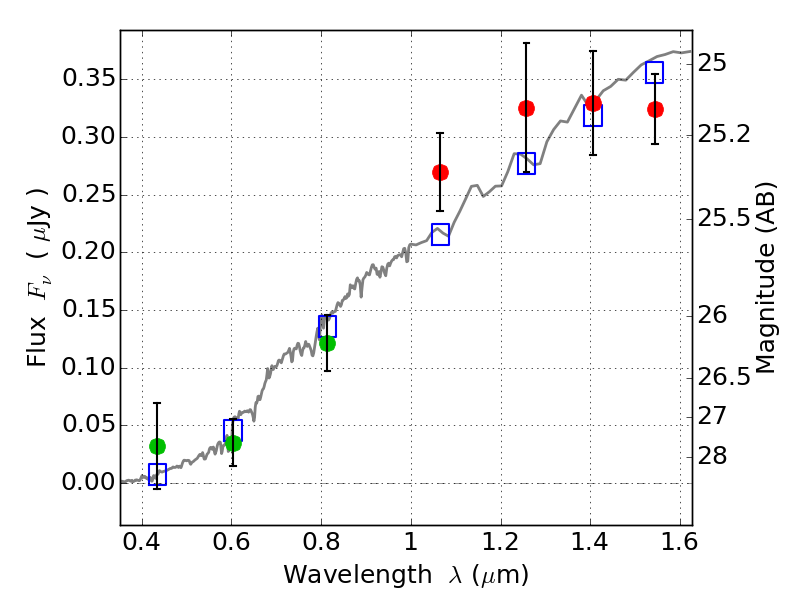
Best viewed in a wide browser window (1200 pixels or more). Download SED & P(z) plots to view larger versions.
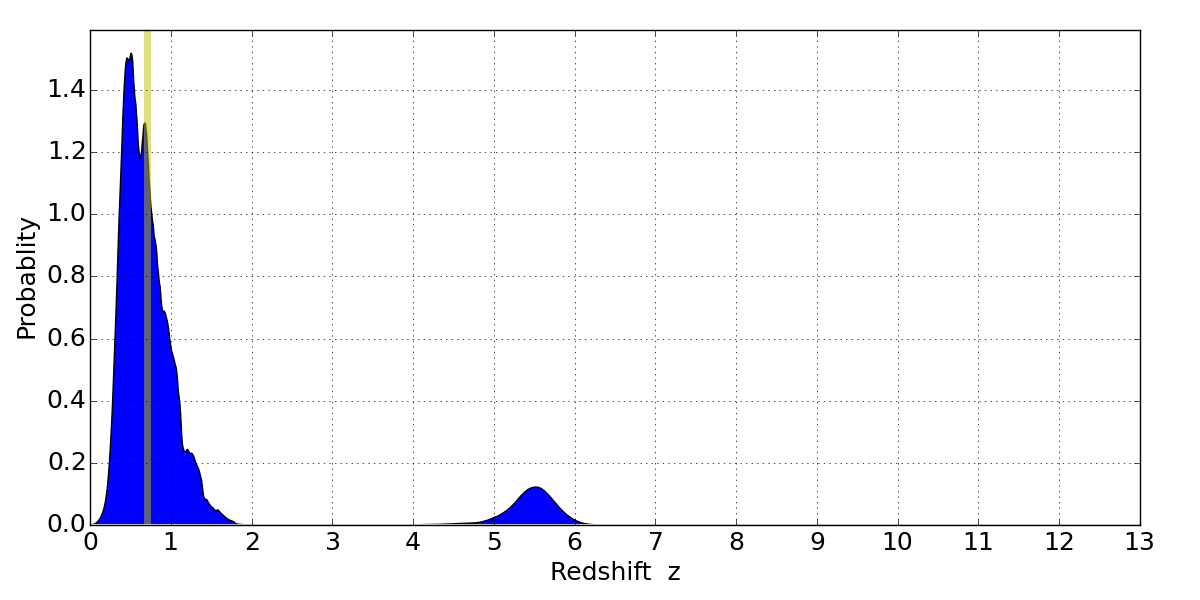
In P(z) plots: Yellow lines mark the cluster redshift z = 0.702,
Object #403 x,y = (2718, 2893) RA, Dec = (02:27:04.872, 49:00:52.92) = (36.77030, 49.01470) BPZ = 0.510 [0.287--5.612] type = 3.00 (Ell5_A_0) chisq2 = 0.92 ODDS = 0.18 z_cluster = 0.702