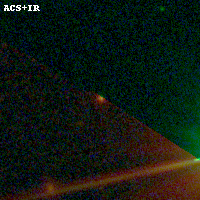
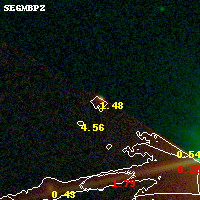
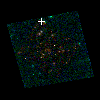
PLCKG138-10 IR detection object #11
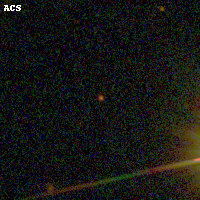
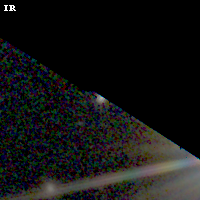
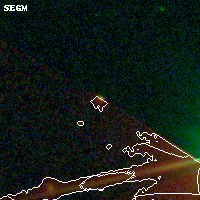
Color images and BPZ results
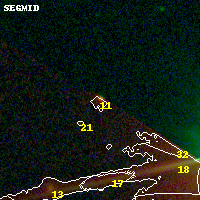
Catalog: 11.cat
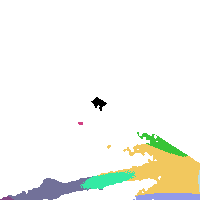
Black segments are analyzed here. Roll mouse over color images to view segments.
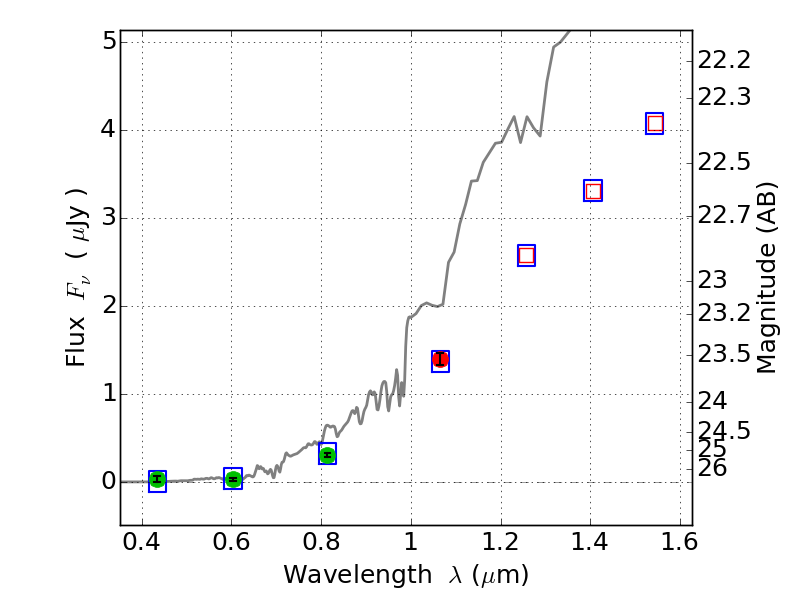
Best viewed in a wide browser window (1200 pixels or more). Download SED & P(z) plots to view larger versions.
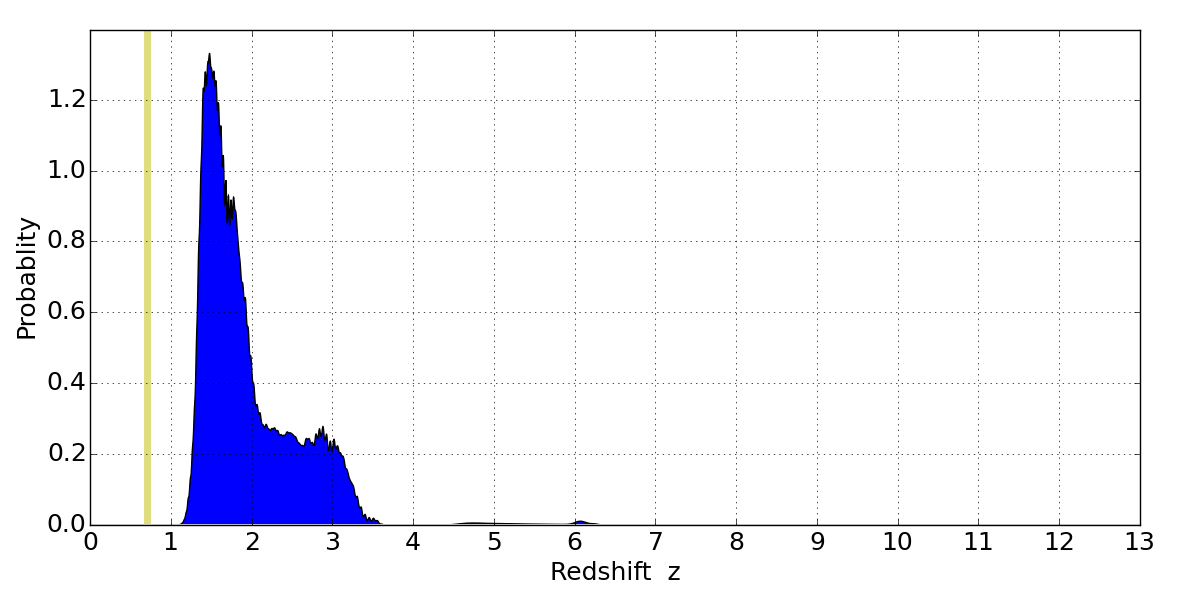
In P(z) plots: Yellow lines mark the cluster redshift z = 0.702,
Object #11 x,y = (2095, 3964) RA, Dec = (02:27:08.688, 49:01:57.36) = (36.78620, 49.03260) BPZ = 1.480 [1.316--3.207] type = 2.00 (Ell6_A_0) chisq2 = 0.03 ODDS = 0.25 z_cluster = 0.702