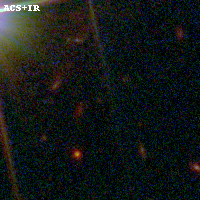
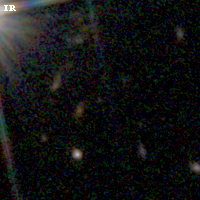
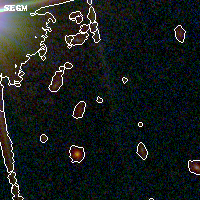
PLCKG138-10 IR detection object #200
Color images and BPZ results
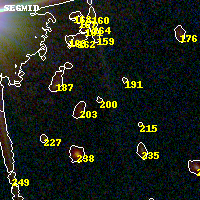
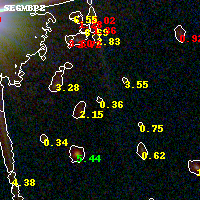
Catalog: 200.cat
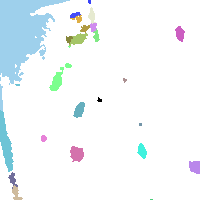
Black segments are analyzed here. Roll mouse over color images to view segments.
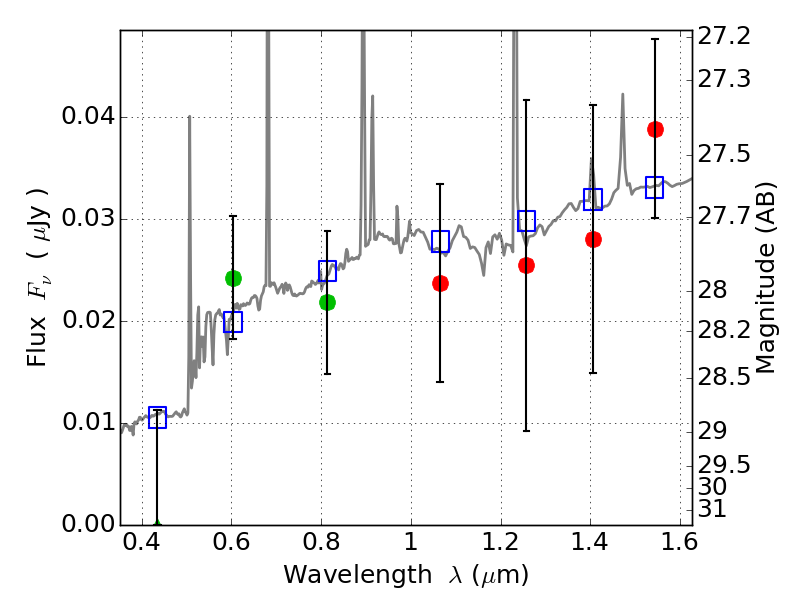
Best viewed in a wide browser window (1200 pixels or more). Download SED & P(z) plots to view larger versions.
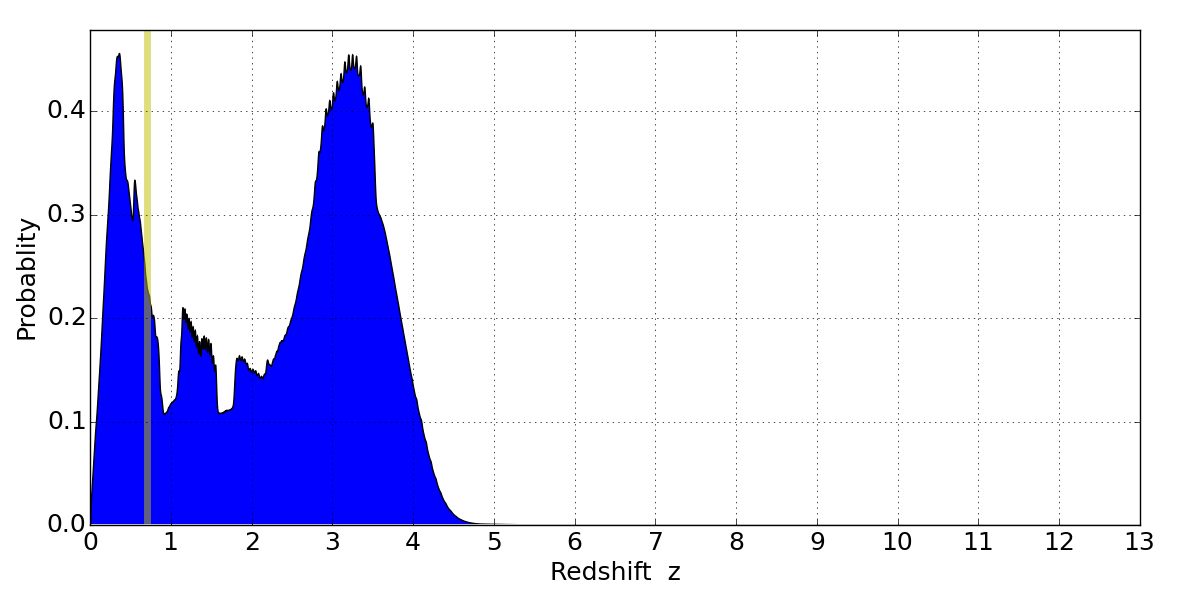
In P(z) plots: Yellow lines mark the cluster redshift z = 0.702,
Object #200 x,y = (2077, 3237) RA, Dec = (02:27:08.784, 49:01:13.80) = (36.78660, 49.02050) BPZ = 0.365 [0.197--4.051] type = 9.00 (SB2_B10) chisq2 = 0.55 ODDS = 0.05 z_cluster = 0.702