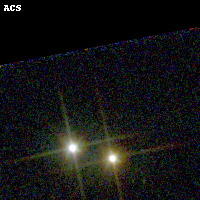
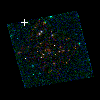
PLCKG138-10 ACS+IR detection object #603
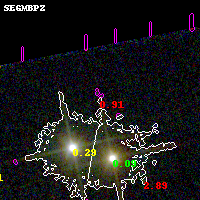
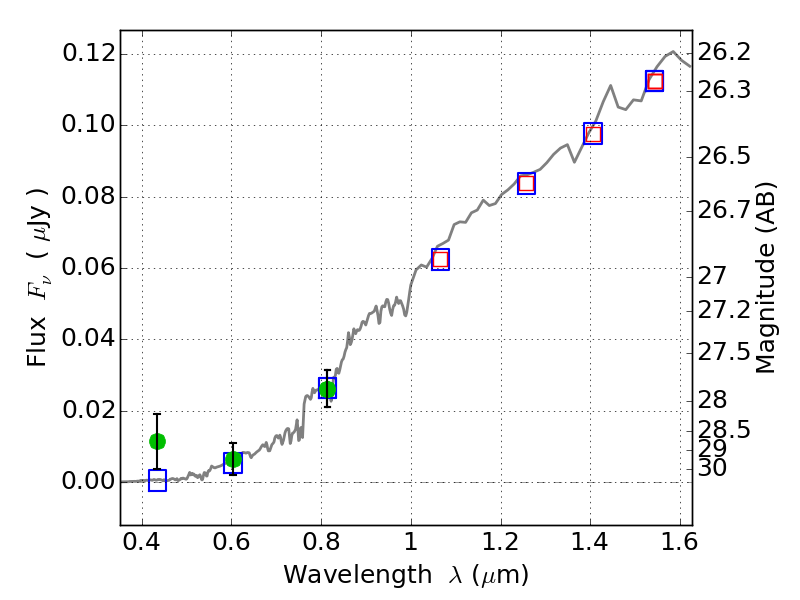
Color images and BPZ results
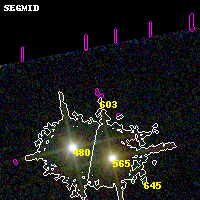
Catalog: 603.cat
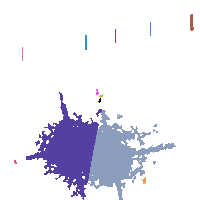
Black segments are analyzed here. Roll mouse over color images to view segments.
Best viewed in a wide browser window (1200 pixels or more). Download SED & P(z) plots to view larger versions.
In P(z) plots: Yellow lines mark the cluster redshift z = 0.702,
Object #603 x,y = (1230, 3934) RA, Dec = (02:27:13.944, 49:01:55.56) = (36.80810, 49.03210) BPZ = 0.912 [0.337--5.926] type = 3.00 (Ell5_A_0) chisq2 = 1.03 ODDS = 0.10 z_cluster = 0.702