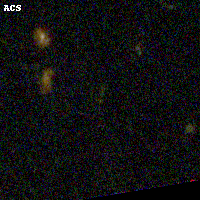
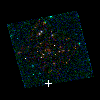
PLCKG138-10 ACS+IR detection object #6002
Color images and BPZ results
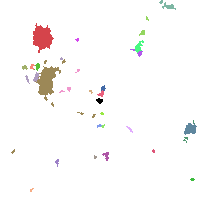
Catalog: 6002.cat
Black segments are analyzed here. Roll mouse over color images to view segments.
Best viewed in a wide browser window (1200 pixels or more). Download SED & P(z) plots to view larger versions.
In P(z) plots: Yellow lines mark the cluster redshift z = 0.702,
Object #6002 x,y = (2411, 888) RA, Dec = (02:27:06.744, 48:58:52.68) = (36.77810, 48.98130) BPZ = 0.425 [0.113--3.695] type = 8.40 (SB1_B10 - SB2_B10) chisq2 = 0.06 ODDS = 0.07 z_cluster = 0.702