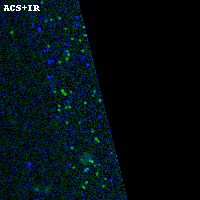
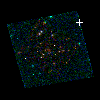
PLCKG138-10 ACS+IR detection object #501
Color images and BPZ results
Catalog: 501.cat
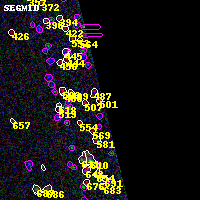
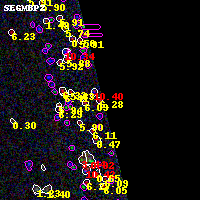
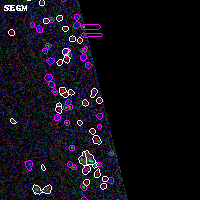
Black segments are analyzed here. Roll mouse over color images to view segments.
Best viewed in a wide browser window (1200 pixels or more). Download SED & P(z) plots to view larger versions.
In P(z) plots: Yellow lines mark the cluster redshift z = 0.702,
Object #501 x,y = (3991, 3920) RA, Dec = (02:26:57.096, 49:01:54.48) = (36.73790, 49.03180) BPZ = 6.281 [5.925--8.764] type = 6.00 (Sbc_B10) chisq2 = 0.00 ODDS = 0.41 z_cluster = 0.702