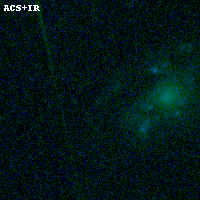
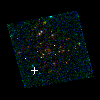
PLCKG138-10 ACS+IR detection object #5007
Color images and BPZ results
Catalog: 5007.cat
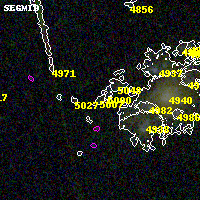
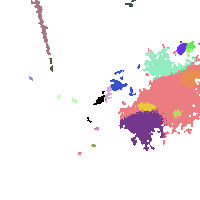
Black segments are analyzed here. Roll mouse over color images to view segments.
Best viewed in a wide browser window (1200 pixels or more). Download SED & P(z) plots to view larger versions.
In P(z) plots: Yellow lines mark the cluster redshift z = 0.702,
Object #5007 x,y = (1709, 1510) RA, Dec = (02:27:11.016, 48:59:30.12) = (36.79590, 48.99170) BPZ = 1.030 [0.407--2.544] type = 10.60 (SB11_A_0_l - SB3_B10) chisq2 = 0.06 ODDS = 0.13 z_cluster = 0.702