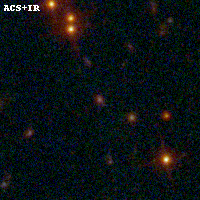
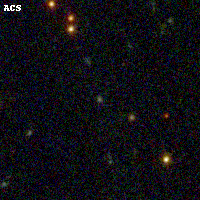
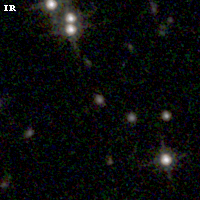
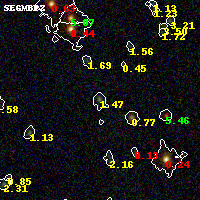
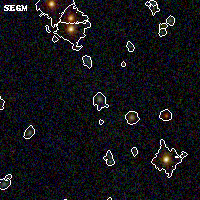
PLCKG138-10 ACS+IR detection object #4003
Color images and BPZ results
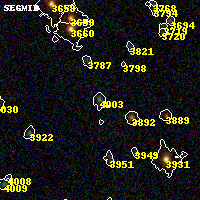
Catalog: 4003.cat
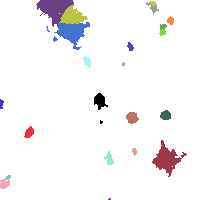
Black segments are analyzed here. Roll mouse over color images to view segments.
Best viewed in a wide browser window (1200 pixels or more). Download SED & P(z) plots to view larger versions.
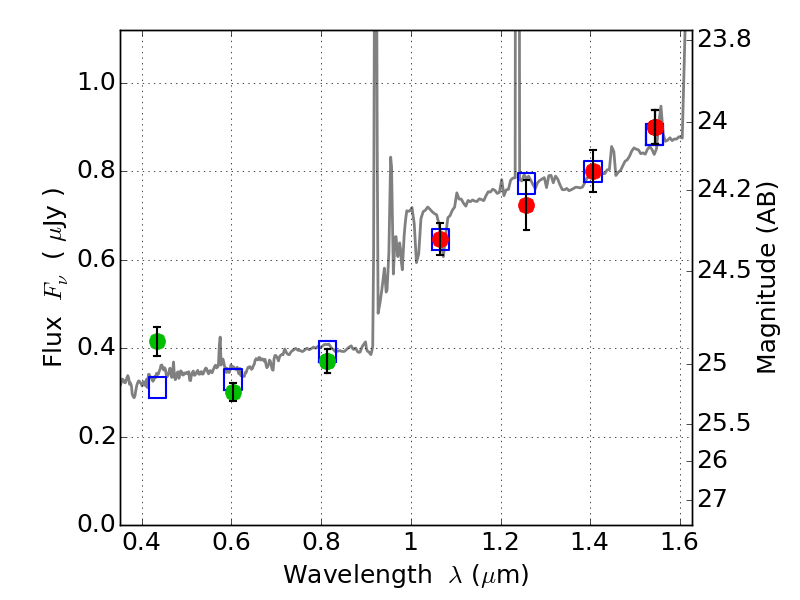
In P(z) plots: Yellow lines mark the cluster redshift z = 0.702,
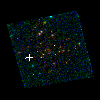
Object #4003 x,y = (1499, 2177) RA, Dec = (02:27:12.312, 49:00:10.08) = (36.80130, 49.00280) BPZ = 1.470 [1.315--1.575] type = 9.30 (SB2_B10 - SB3_B10) chisq2 = 0.48 ODDS = 0.88 z_cluster = 0.702