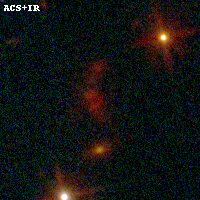
PLCKG138-10 ACS+IR detection object #2019
Color images and BPZ results
Catalog: 2019.cat
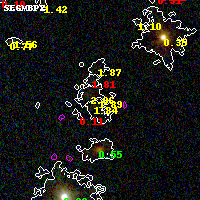
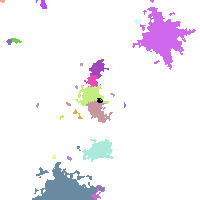
Black segments are analyzed here. Roll mouse over color images to view segments.
Best viewed in a wide browser window (1200 pixels or more). Download SED & P(z) plots to view larger versions.
In P(z) plots: Yellow lines mark the cluster redshift z = 0.702,
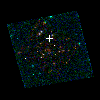
Object #2019 x,y = (2450, 3112) RA, Dec = (02:27:06.504, 49:01:06.24) = (36.77710, 49.01840) BPZ = 1.890 [1.652--2.165] type = 4.00 (Ell4_A_0) chisq2 = 0.14 ODDS = 0.64 z_cluster = 0.702