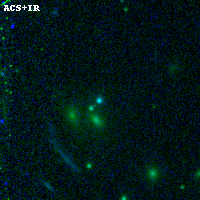
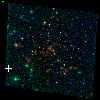
PLCKG004-19 ACS+IR detection object #7020
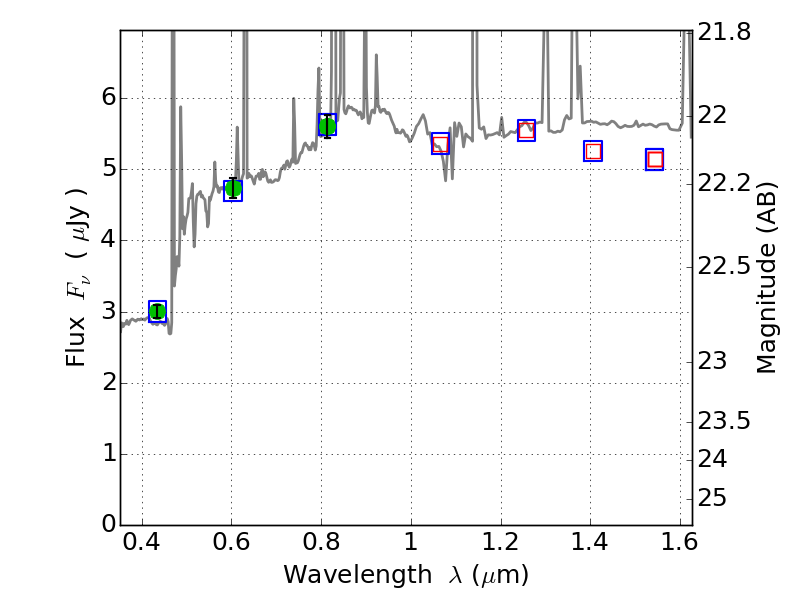
Color images and BPZ results
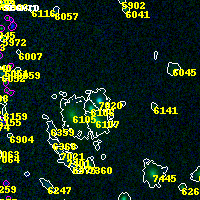
Catalog: 7020.cat
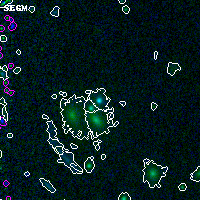
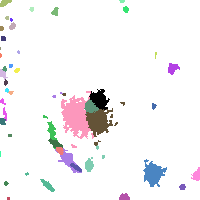
Black segments are analyzed here. Roll mouse over color images to view segments.
Best viewed in a wide browser window (1200 pixels or more). Download SED & P(z) plots to view larger versions.
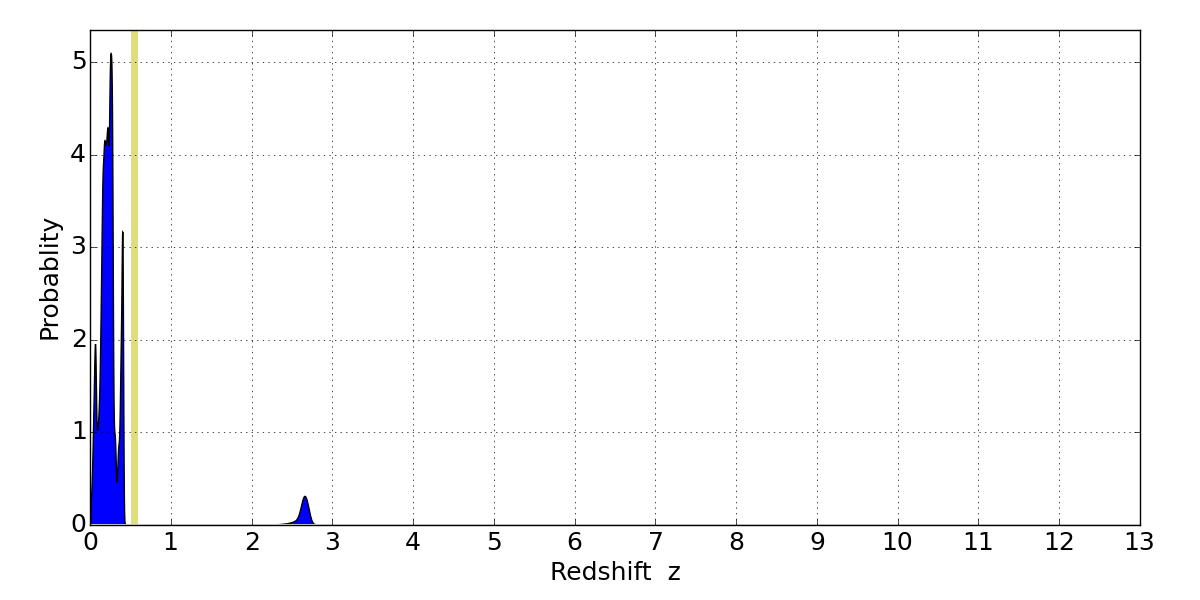
In P(z) plots: Yellow lines mark the cluster redshift z = 0.540,
Object #7020 x,y = (350, 1303) RA, Dec = (19:17:12.792, -33:32:07.44) = (289.30330, -33.53540) BPZ = 0.262 [0.050--2.639] type = 9.60 (SB3_B10 - SB2_B10) chisq2 = 0.02 ODDS = 0.38 z_cluster = 0.540