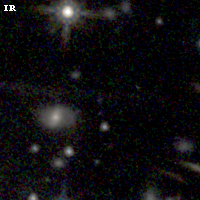
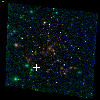
PLCKG004-19 ACS+IR detection object #6001
Color images and BPZ results
Catalog: 6001.cat
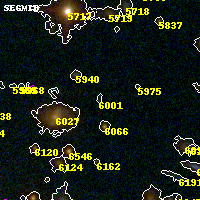
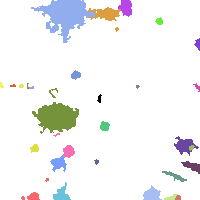
Black segments are analyzed here. Roll mouse over color images to view segments.
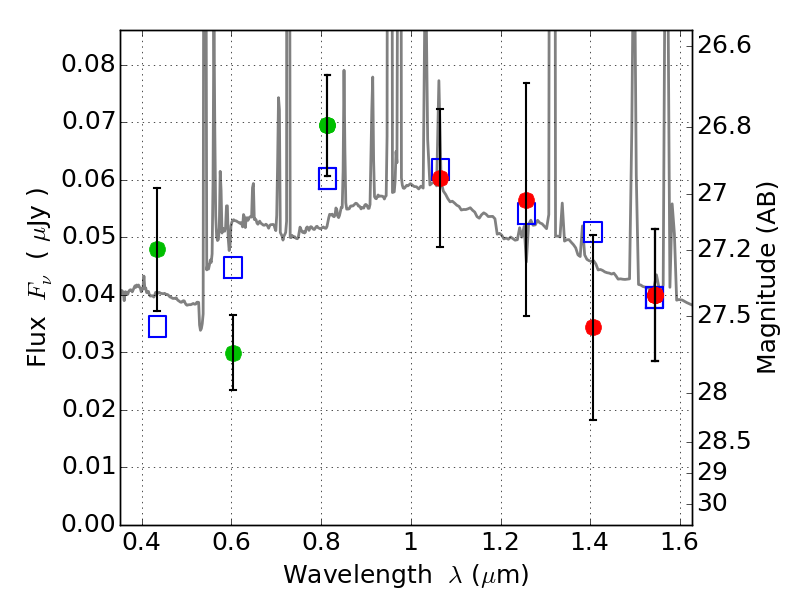
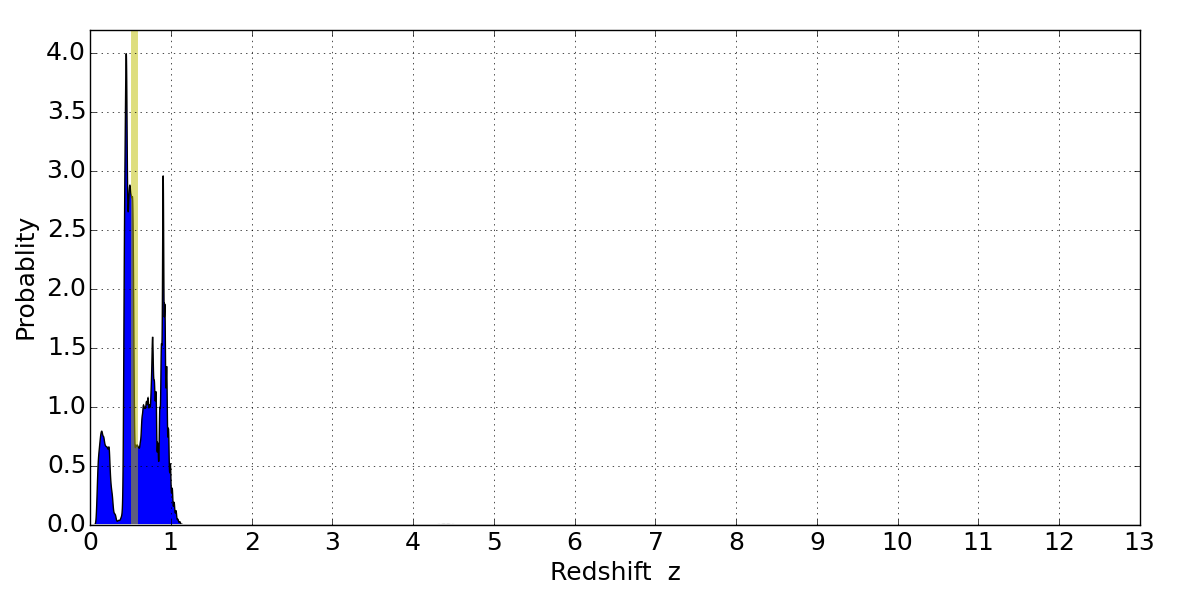
Best viewed in a wide browser window (1200 pixels or more). Download SED & P(z) plots to view larger versions.
In P(z) plots: Yellow lines mark the cluster redshift z = 0.540,
Object #6001 x,y = (1457, 1351) RA, Dec = (19:17:07.488, -33:32:04.56) = (289.28120, -33.53460) BPZ = 0.449 [0.127--0.986] type = 10.00 (SB3_B10) chisq2 = 1.13 ODDS = 0.28 z_cluster = 0.540