PLCKG004-19 ACS+IR detection object #536
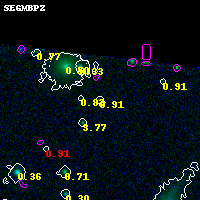
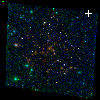
Color images and BPZ results
Catalog: 536.cat
Black segments are analyzed here. Roll mouse over color images to view segments.
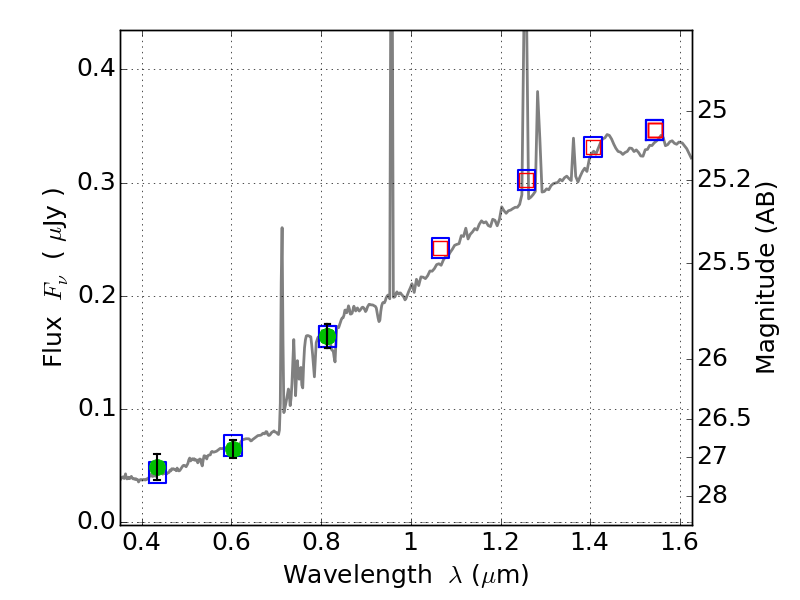
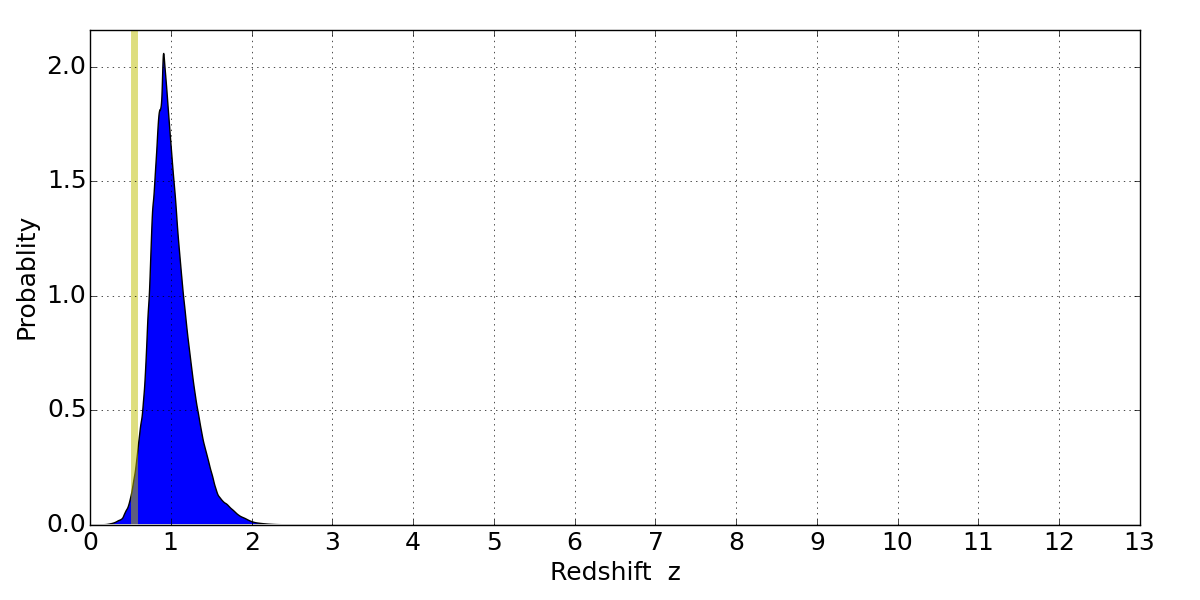
Best viewed in a wide browser window (1200 pixels or more). Download SED & P(z) plots to view larger versions.
In P(z) plots: Yellow lines mark the cluster redshift z = 0.540,
Object #536 x,y = (3548, 3492) RA, Dec = (19:16:57.456, -33:29:56.04) = (289.23940, -33.49890) BPZ = 0.912 [0.582--1.611] type = 7.50 (SB1_B10 - Scd_B10) chisq2 = 0.06 ODDS = 0.29 z_cluster = 0.540