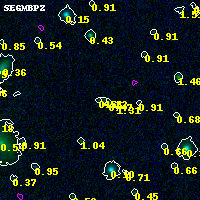
PLCKG004-19 ACS+IR detection object #2013
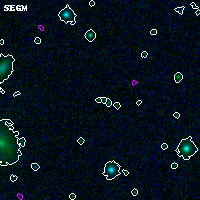
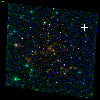
Color images and BPZ results
Catalog: 2013.cat
Black segments are analyzed here. Roll mouse over color images to view segments.
Best viewed in a wide browser window (1200 pixels or more). Download SED & P(z) plots to view larger versions.
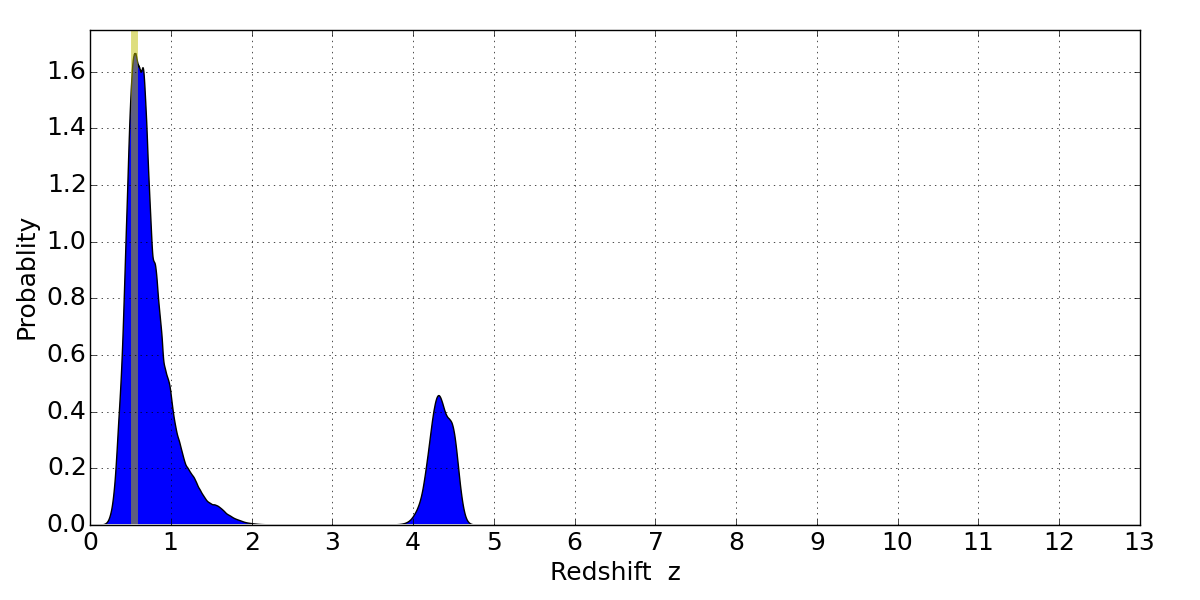
In P(z) plots: Yellow lines mark the cluster redshift z = 0.540,
Object #2013 x,y = (3388, 2926) RA, Dec = (19:16:58.224, -33:30:30.24) = (289.24260, -33.50840) BPZ = 0.561 [0.374--4.508] type = 5.90 (Sbc_B10 - ES0_B10) chisq2 = 0.08 ODDS = 0.20 z_cluster = 0.540