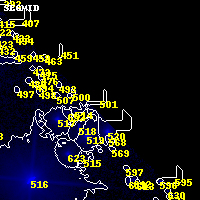
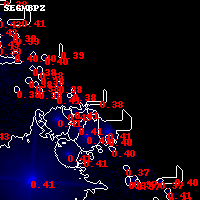
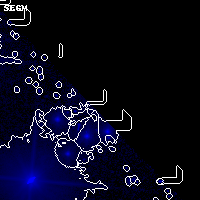
PLCKG004-19-PAR IR detection object #501
Color images and BPZ results
Catalog: 501.cat
Black segments are analyzed here. Roll mouse over color images to view segments.
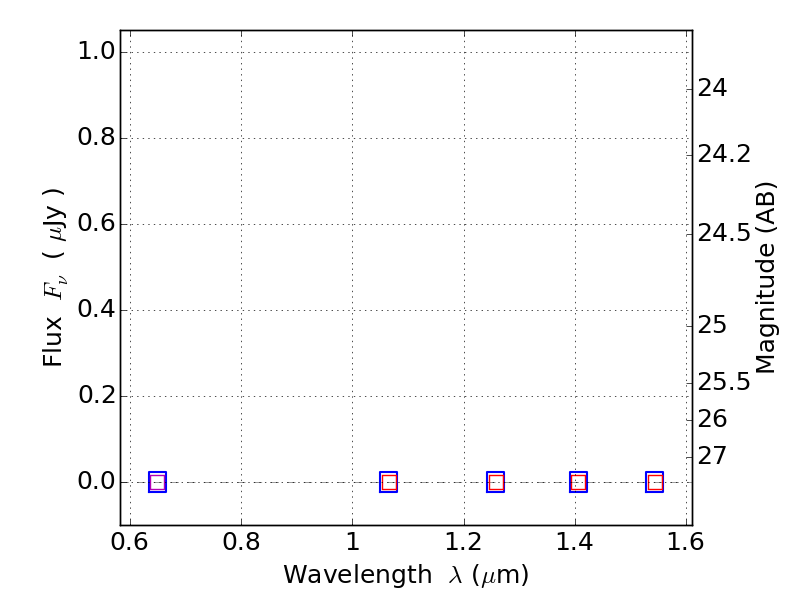
Best viewed in a wide browser window (1200 pixels or more). Download SED & P(z) plots to view larger versions.
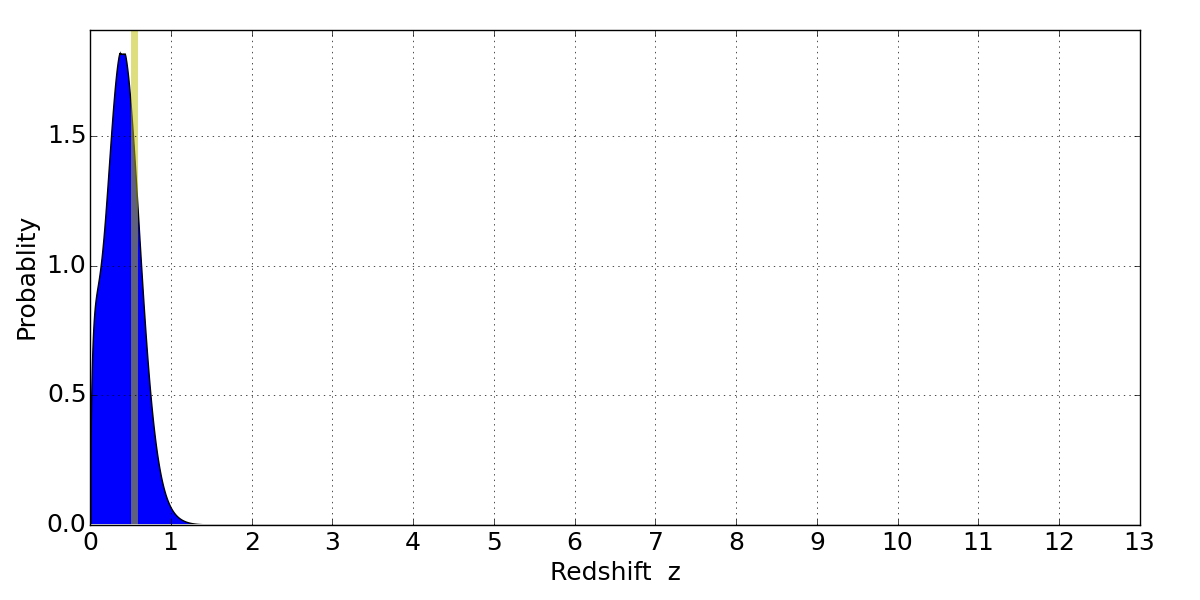
In P(z) plots: Yellow lines mark the cluster redshift z = 0.540,
Object #501 x,y = (3266, 3734) RA, Dec = (19:17:23.328, -33:34:06.96) = (289.34720, -33.56860) BPZ = 0.375 [0.051--0.865] type = 6.00 (Sbc_B10) chisq2 = 999.00 ODDS = 0.20 z_cluster = 0.540