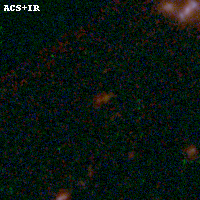
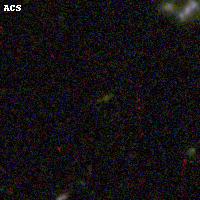
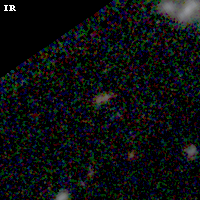
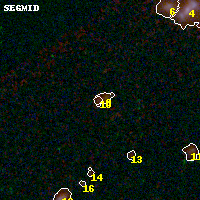
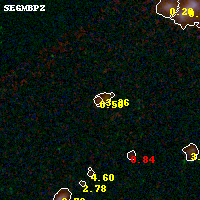
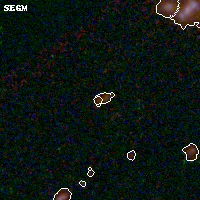
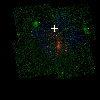
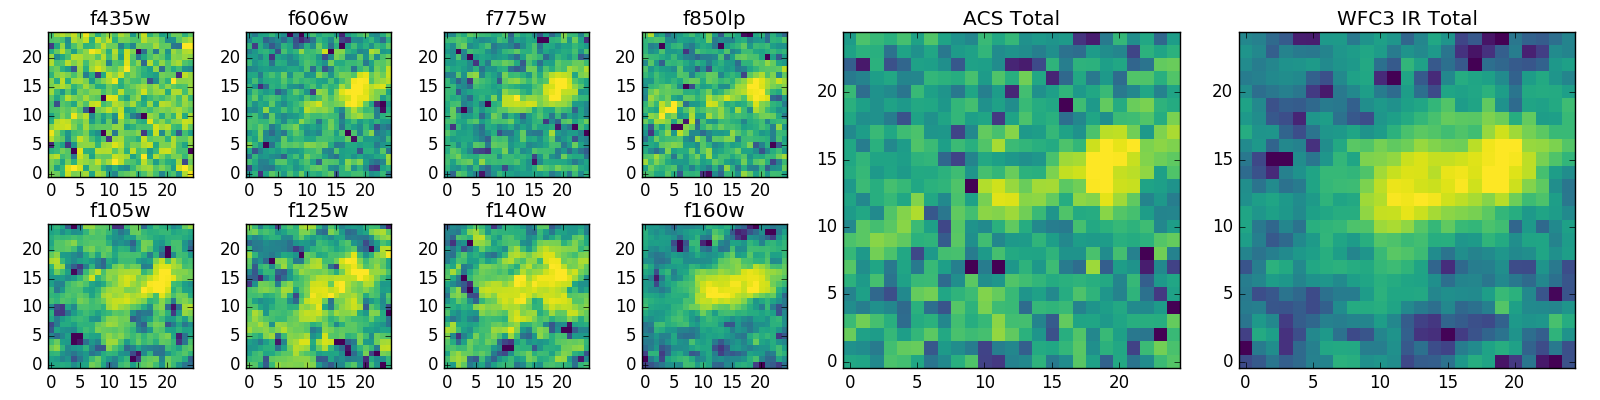
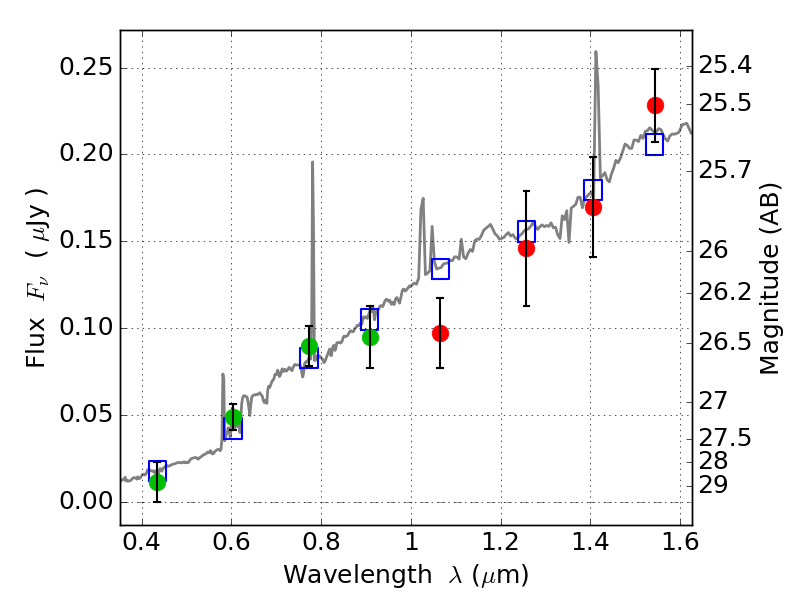
Color images and BPZ results
Catalog: 10.cat
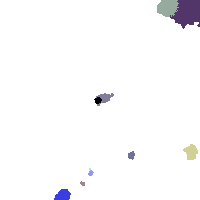
Black segments are analyzed here. Roll mouse over color images to view segments. Best viewed in a wide browser window (1200 pixels or more). Download SED & P(z) plots to view larger versions.
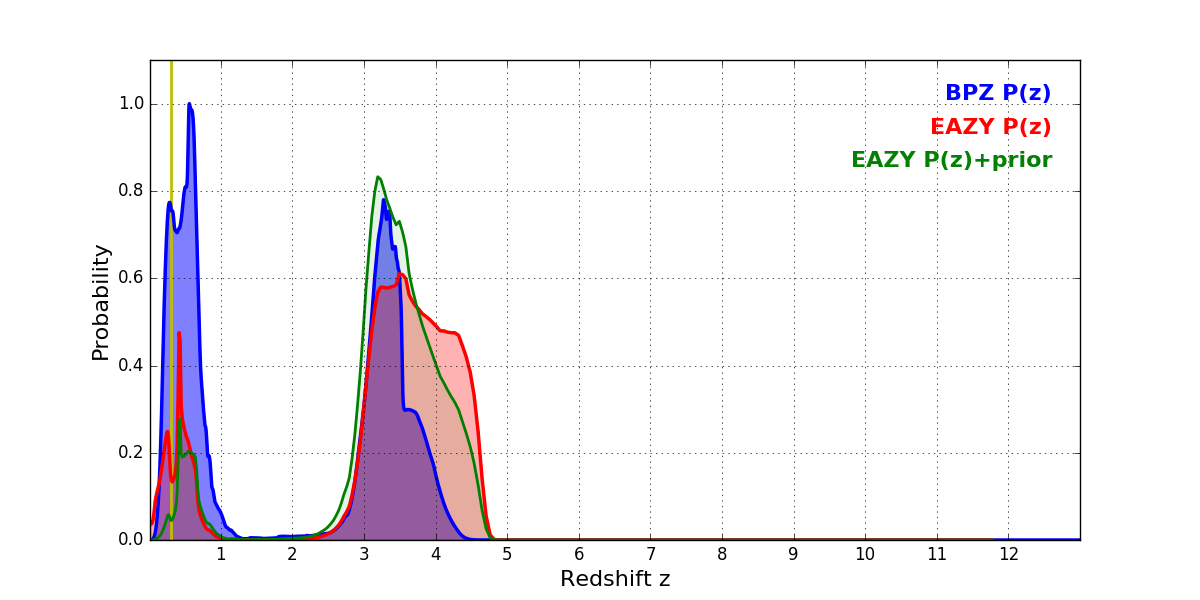
In P(z) plots: Yellow lines mark the cluster redshift z = 0.306,