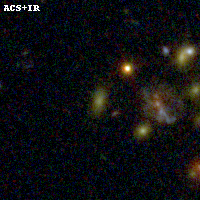
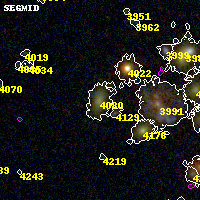
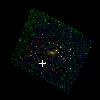
MACS0257-23 ACS+IR detection object #4080
Color images and BPZ results
Catalog: 4080.cat
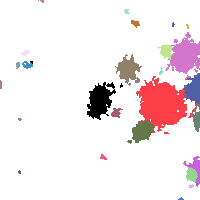
Black segments are analyzed here. Roll mouse over color images to view segments.
Best viewed in a wide browser window (1200 pixels or more). Download SED & P(z) plots to view larger versions.
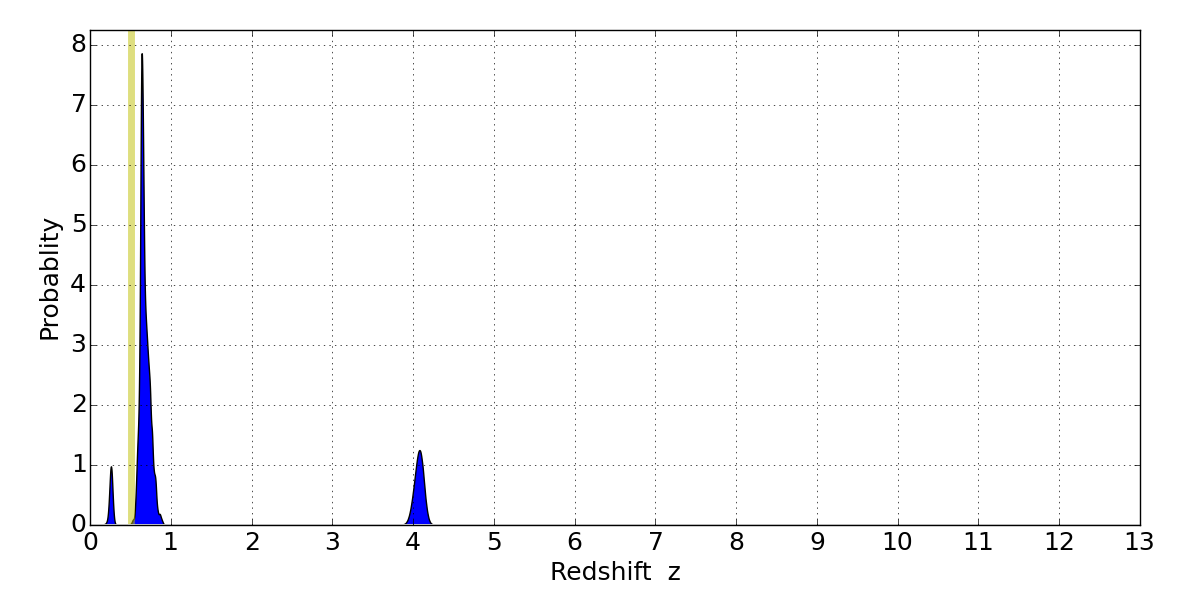
In P(z) plots: Yellow lines mark the cluster redshift z = 0.505,
Object #4080 x,y = (2558, 2265) RA, Dec = (02:57:11.136, -23:26:40.92) = (44.29640, -23.44470) BPZ = 0.647 [0.264--4.137] type = 7.60 (SB1_B10 - Scd_B10) chisq2 = 0.42 ODDS = 0.55 z_cluster = 0.505