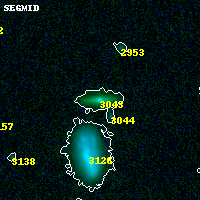
MACS0257-23 ACS+IR detection object #3043
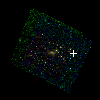
Color images and BPZ results
Catalog: 3043.cat
Black segments are analyzed here. Roll mouse over color images to view segments.
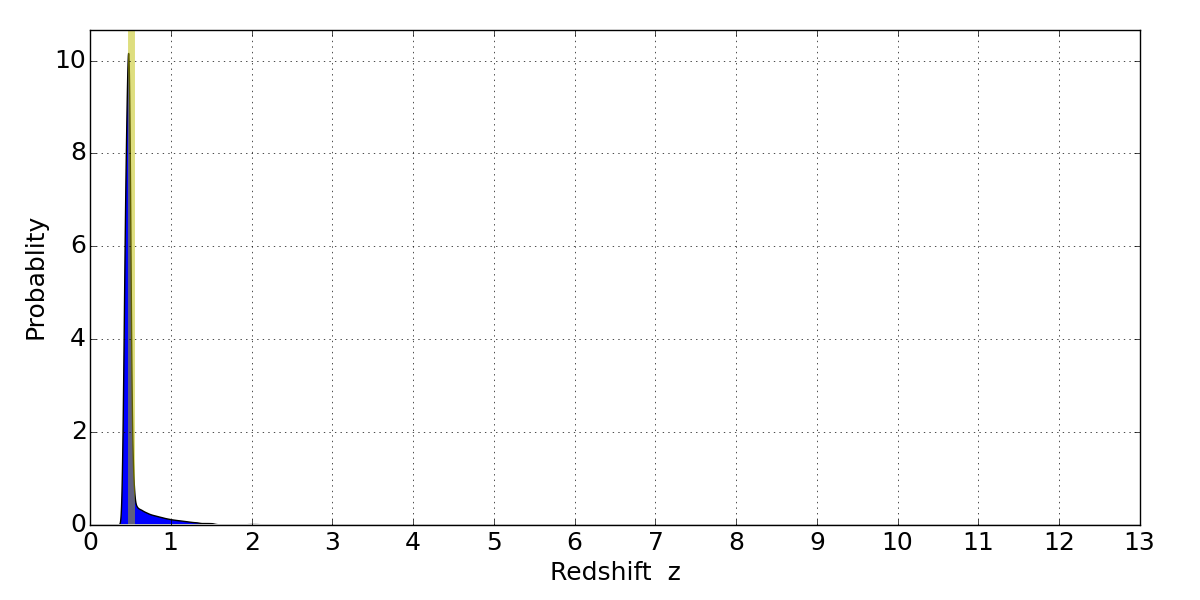
Best viewed in a wide browser window (1200 pixels or more). Download SED & P(z) plots to view larger versions.
In P(z) plots: Yellow lines mark the cluster redshift z = 0.505,
Object #3043 x,y = (4387, 2874) RA, Dec = (02:57:03.168, -23:26:04.20) = (44.26320, -23.43450) BPZ = 0.479 [0.409--1.120] type = 2.80 (Ell5_A_0 - Ell6_A_0) chisq2 = 0.00 ODDS = 0.79 z_cluster = 0.505