MACS0257-23 ACS+IR detection object #1041
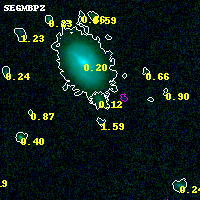
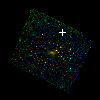
Color images and BPZ results
Catalog: 1041.cat
Black segments are analyzed here. Roll mouse over color images to view segments.
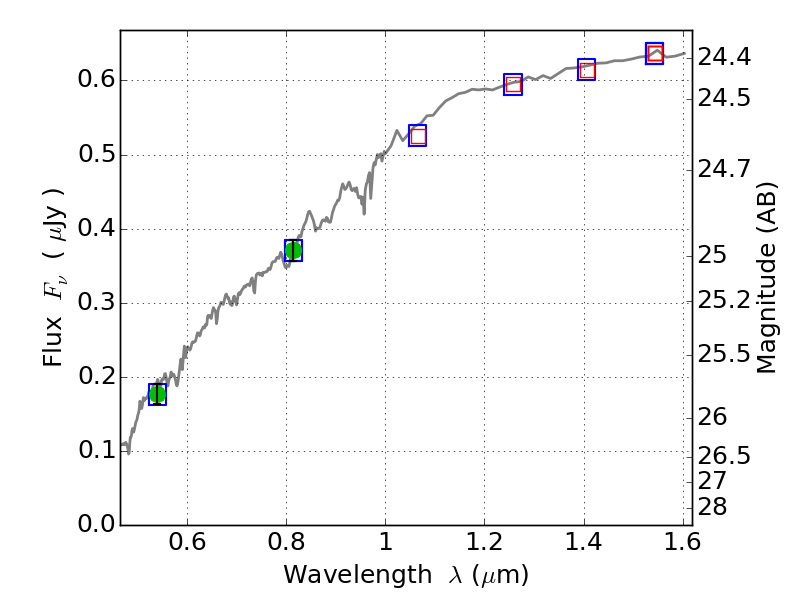
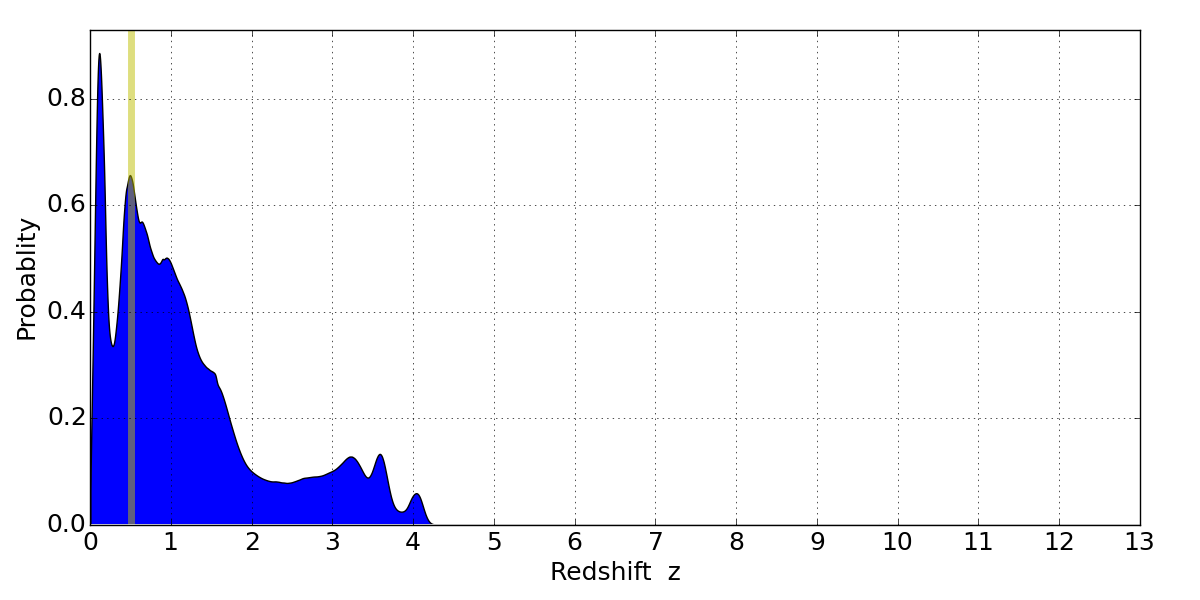
Best viewed in a wide browser window (1200 pixels or more). Download SED & P(z) plots to view larger versions.
In P(z) plots: Yellow lines mark the cluster redshift z = 0.505,
Object #1041 x,y = (3773, 4114) RA, Dec = (02:57:05.832, -23:24:49.68) = (44.27430, -23.41380) BPZ = 0.120 [0.077--3.640] type = 4.00 (Ell4_A_0) chisq2 = 0.00 ODDS = 0.07 z_cluster = 0.505