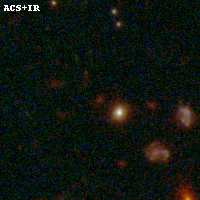
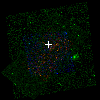
ACT0102-49 IR detection object #541
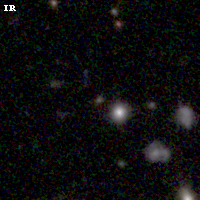
Color images and BPZ results
Catalog: 541.cat
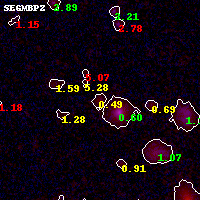
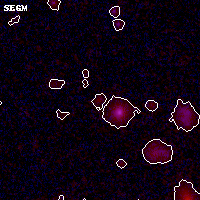
Black segments are analyzed here. Roll mouse over color images to view segments.
Best viewed in a wide browser window (1200 pixels or more). Download SED & P(z) plots to view larger versions.
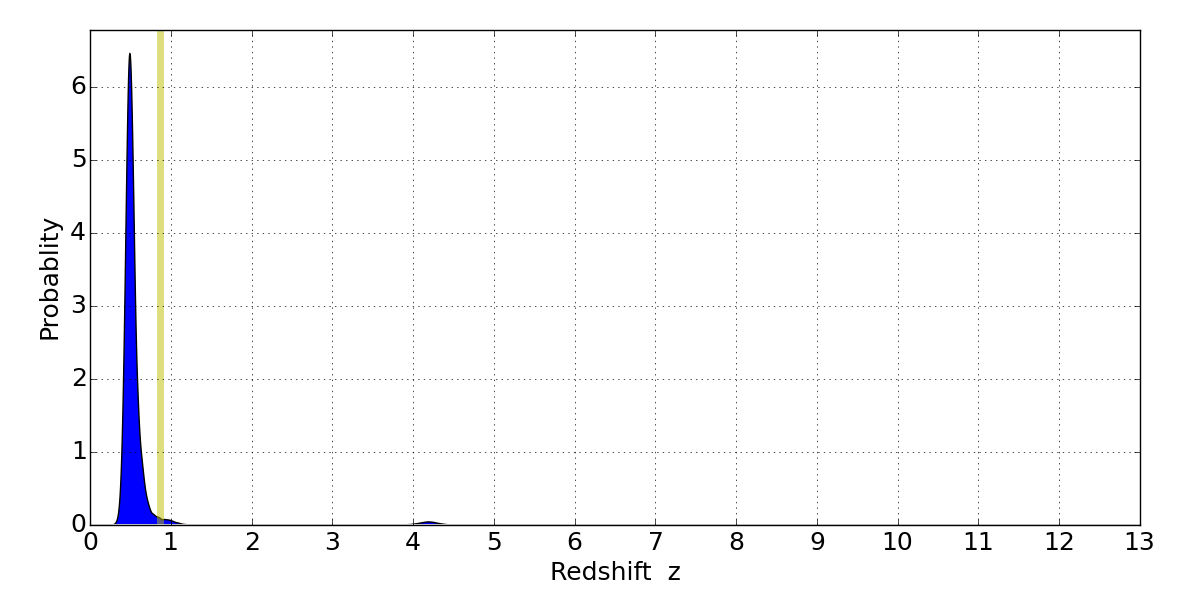
In P(z) plots: Yellow lines mark the cluster redshift z = 0.870,
Object #541 x,y = (3881, 4513) RA, Dec = (01:02:55.344, -49:14:51.00) = (15.73060, -49.24750) BPZ = 0.494 [0.396--0.898] type = 2.00 (Ell6_A_0) chisq2 = 0.32 ODDS = 0.64 z_cluster = 0.870