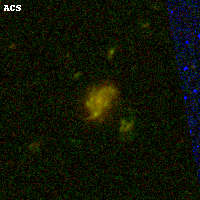
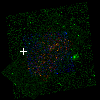
ACT0102-49 ACS+IR detection object #9199
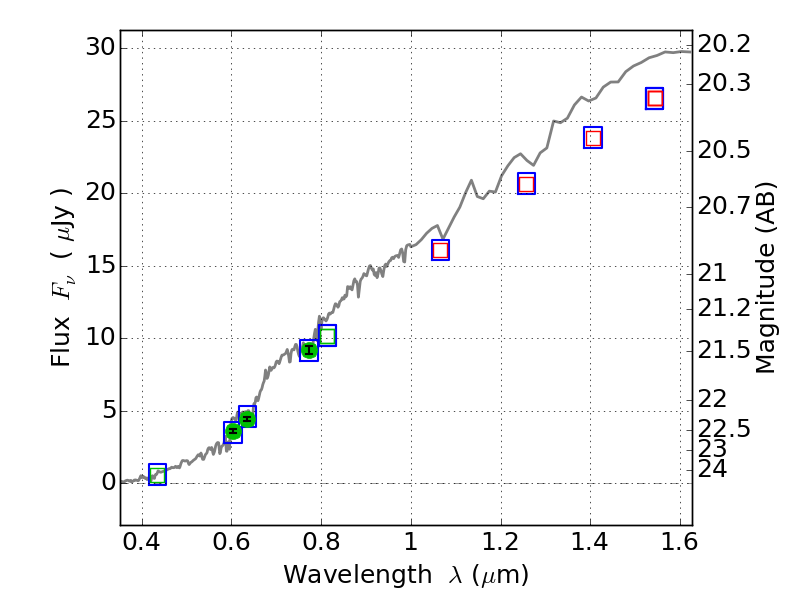
Color images and BPZ results
Catalog: 9199.cat
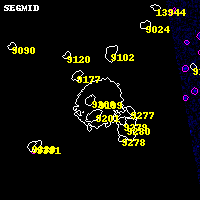
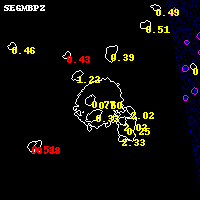
Black segments are analyzed here. Roll mouse over color images to view segments.
Best viewed in a wide browser window (1200 pixels or more). Download SED & P(z) plots to view larger versions.
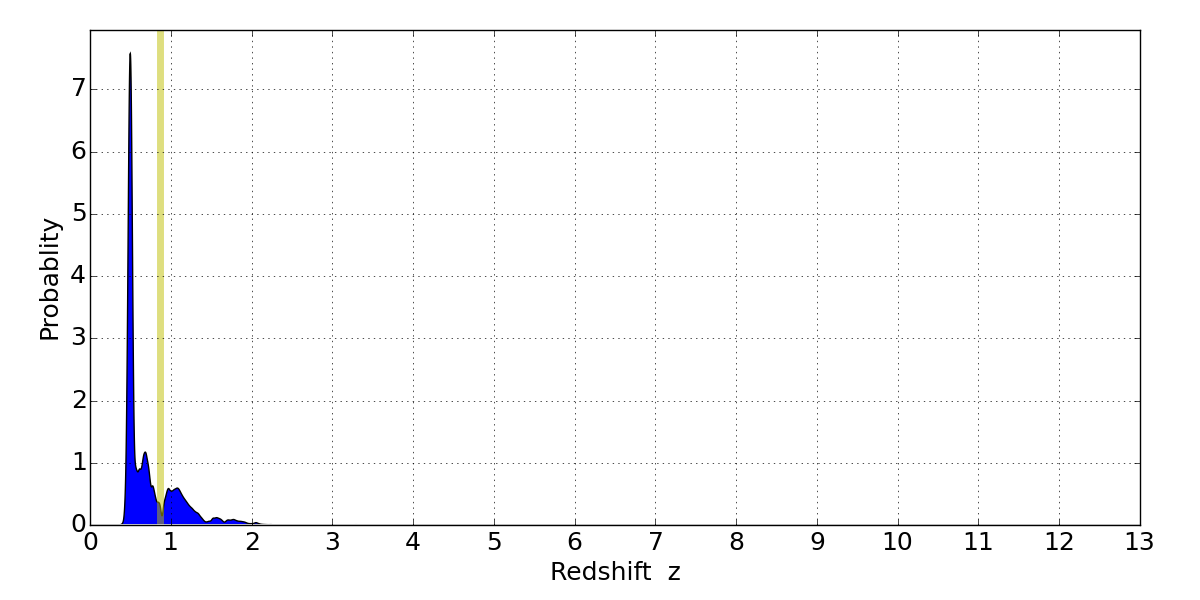
In P(z) plots: Yellow lines mark the cluster redshift z = 0.870,
Object #9199 x,y = (1907, 3967) RA, Dec = (01:03:07.440, -49:15:23.76) = (15.78100, -49.25660) BPZ = 0.499 [0.453--1.708] type = 2.90 (Ell5_A_0 - Ell6_A_0) chisq2 = 0.01 ODDS = 0.50 z_cluster = 0.870