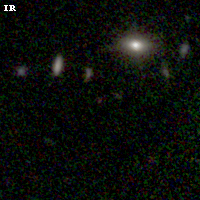
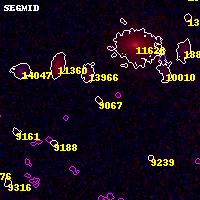
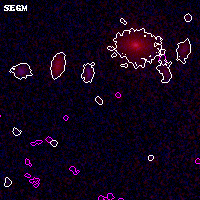
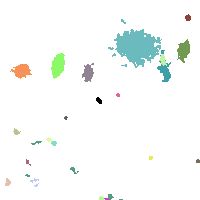
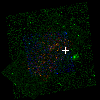
ACT0102-49 ACS+IR detection object #9067
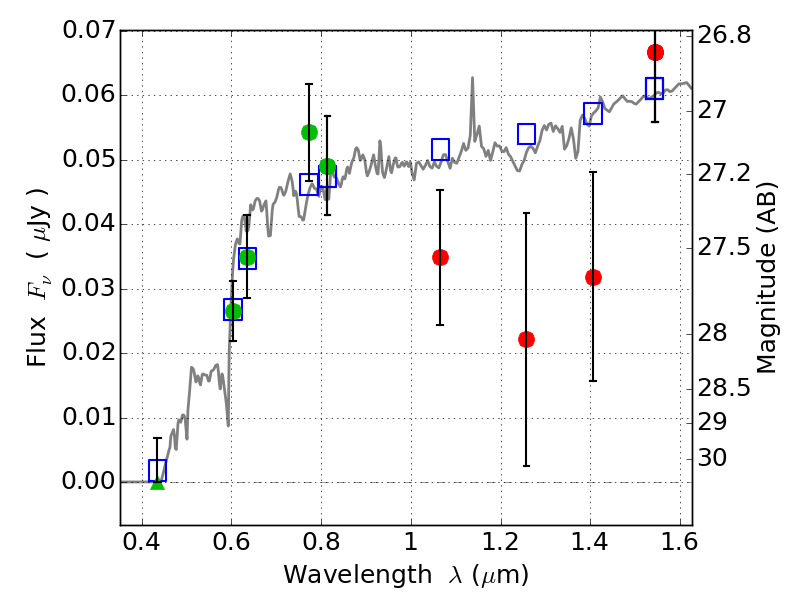
Color images and BPZ results
Catalog: 9067.cat
Black segments are analyzed here. Roll mouse over color images to view segments.
Best viewed in a wide browser window (1200 pixels or more). Download SED & P(z) plots to view larger versions.
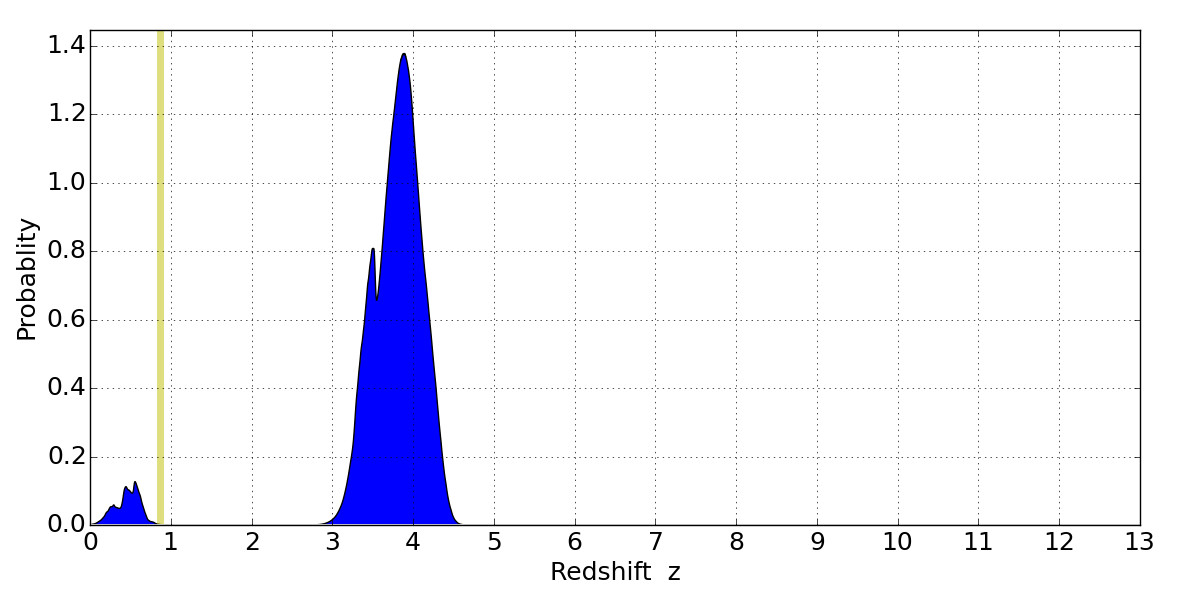
In P(z) plots: Yellow lines mark the cluster redshift z = 0.870,
Object #9067 x,y = (5247, 4029) RA, Dec = (01:02:46.968, -49:15:19.80) = (15.69570, -49.25550) BPZ = 3.889 [0.527--4.318] type = 9.10 (SB2_B10 - SB3_B10) chisq2 = 0.97 ODDS = 0.48 z_cluster = 0.870