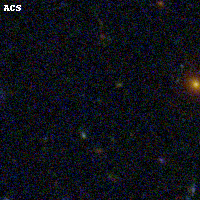
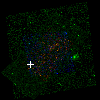
ACT0102-49 ACS+IR detection object #6651
Color images and BPZ results
Catalog: 6651.cat
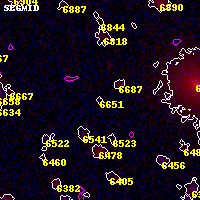
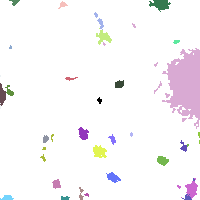
Black segments are analyzed here. Roll mouse over color images to view segments.
Best viewed in a wide browser window (1200 pixels or more). Download SED & P(z) plots to view larger versions.
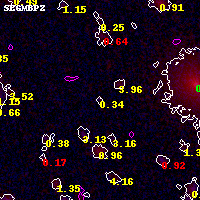
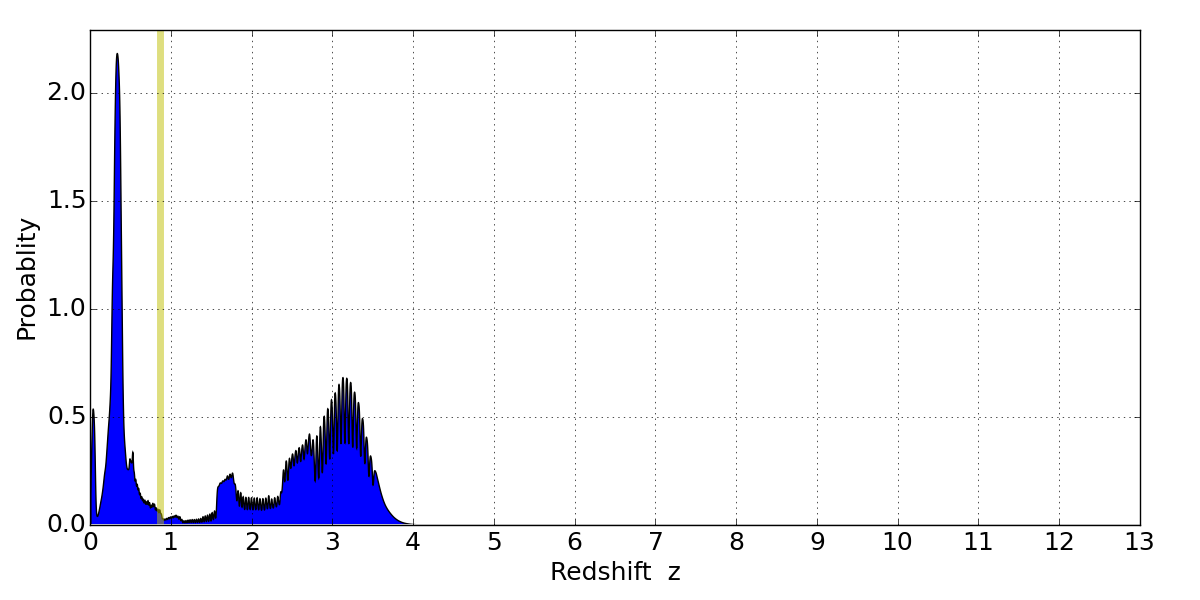
In P(z) plots: Yellow lines mark the cluster redshift z = 0.870,
Object #6651 x,y = (2435, 2931) RA, Dec = (01:03:04.200, -49:16:25.68) = (15.76750, -49.27380) BPZ = 0.338 [0.074--3.554] type = 10.70 (SB11_A_0_l - SB3_B10) chisq2 = 0.26 ODDS = 0.20 z_cluster = 0.870