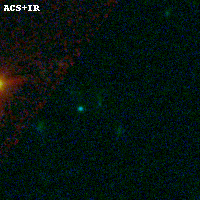
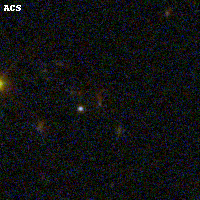
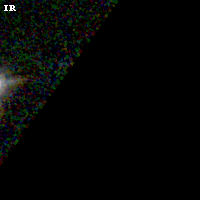
ACT0102-49 ACS+IR detection object #5363
Color images and BPZ results
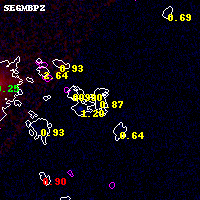
Catalog: 5363.cat
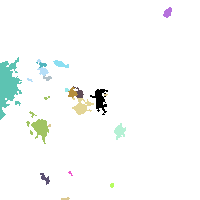
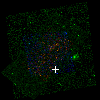
Black segments are analyzed here. Roll mouse over color images to view segments.
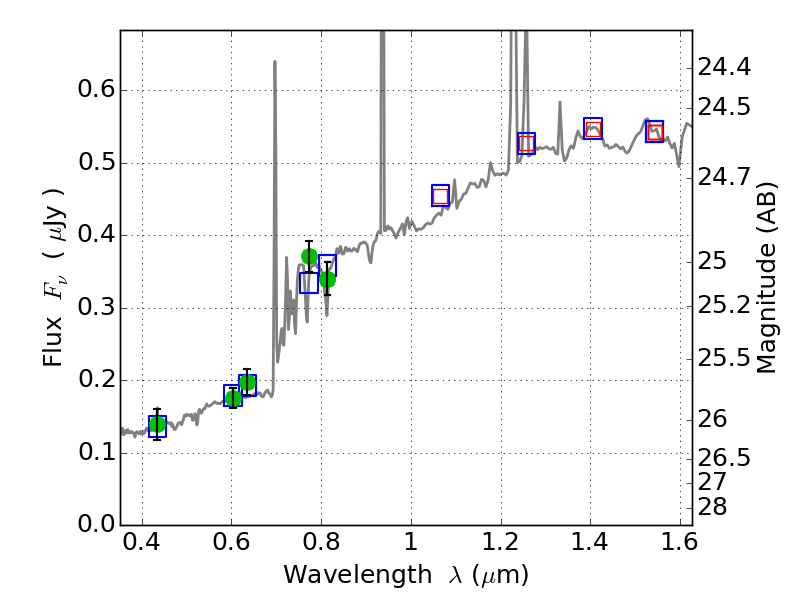
Best viewed in a wide browser window (1200 pixels or more). Download SED & P(z) plots to view larger versions.
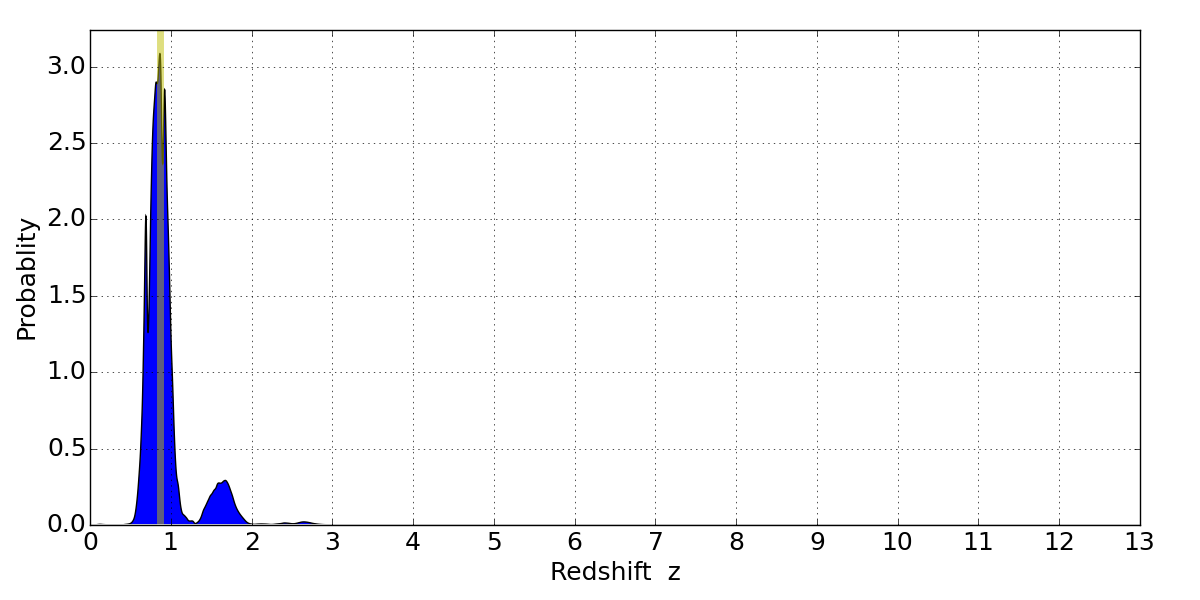
In P(z) plots: Yellow lines mark the cluster redshift z = 0.870,
Object #5363 x,y = (4403, 2522) RA, Dec = (01:02:52.128, -49:16:50.52) = (15.71720, -49.28070) BPZ = 0.866 [0.636--1.759] type = 8.60 (SB2_B10 - SB1_B10) chisq2 = 0.38 ODDS = 0.42 z_cluster = 0.870