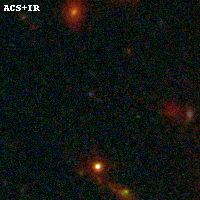
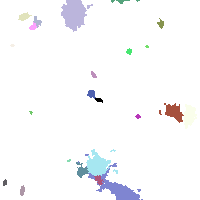
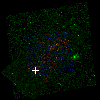
ACT0102-49 ACS+IR detection object #5083
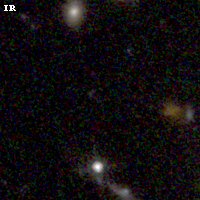
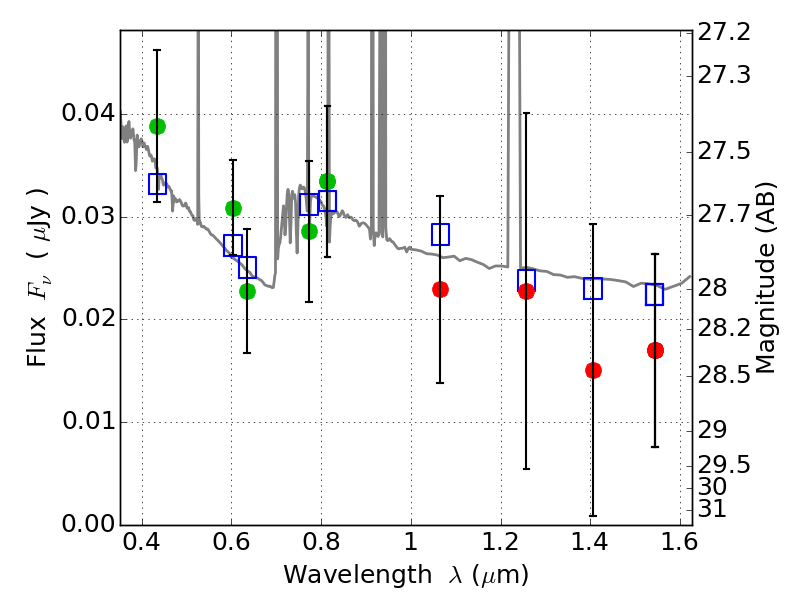
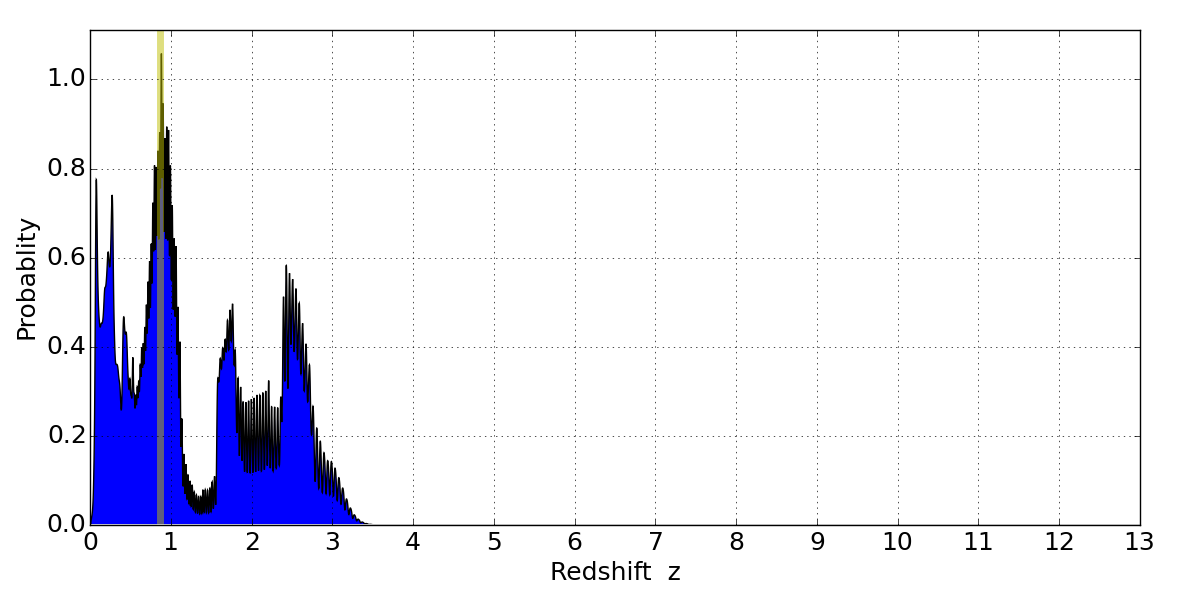
Color images and BPZ results
Catalog: 5083.cat
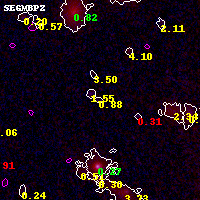
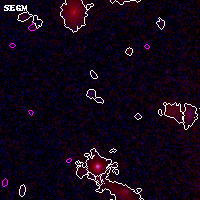
Black segments are analyzed here. Roll mouse over color images to view segments.
Best viewed in a wide browser window (1200 pixels or more). Download SED & P(z) plots to view larger versions.
In P(z) plots: Yellow lines mark the cluster redshift z = 0.870,
Object #5083 x,y = (2812, 2431) RA, Dec = (01:03:01.896, -49:16:55.92) = (15.75790, -49.28220) BPZ = 0.884 [0.092--2.942] type = 11.00 (SB11_A_0_l) chisq2 = 0.34 ODDS = 0.12 z_cluster = 0.870