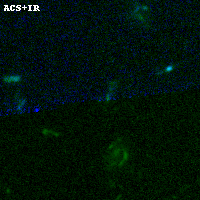
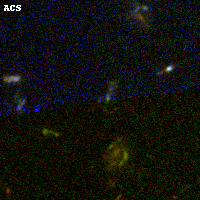
ACT0102-49 ACS+IR detection object #4111
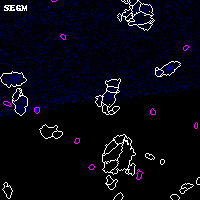
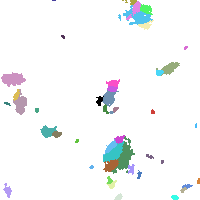
Color images and BPZ results
Catalog: 4111.cat
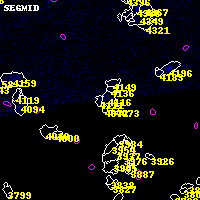
Black segments are analyzed here. Roll mouse over color images to view segments.
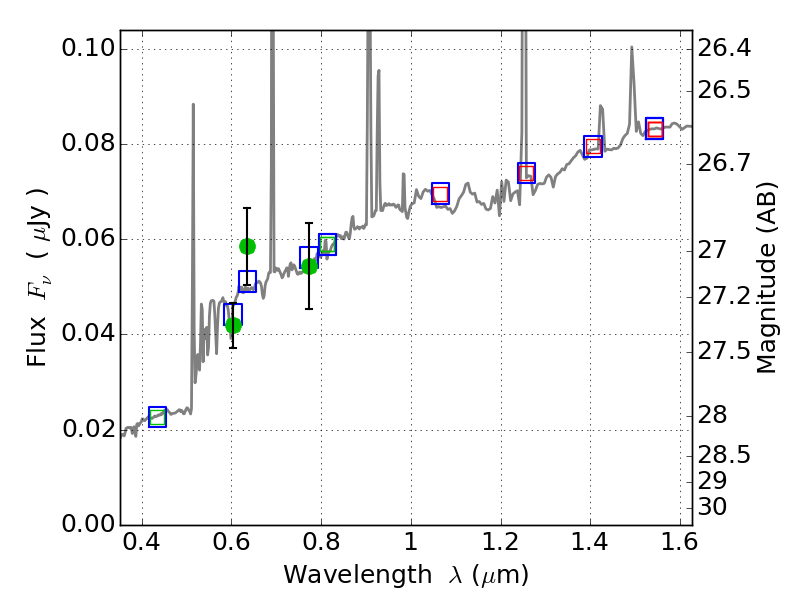
Best viewed in a wide browser window (1200 pixels or more). Download SED & P(z) plots to view larger versions.
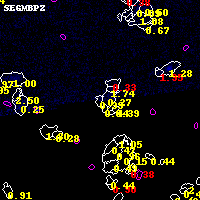
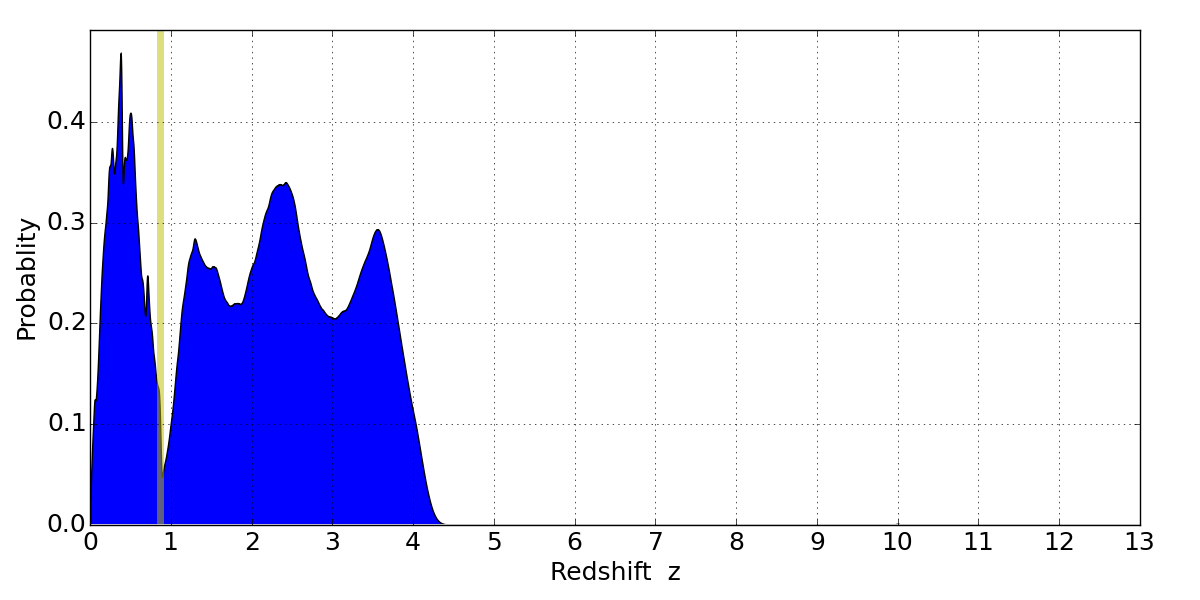
In P(z) plots: Yellow lines mark the cluster redshift z = 0.870,
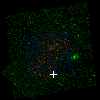
Object #4111 x,y = (4282, 2122) RA, Dec = (01:02:52.872, -49:17:14.28) = (15.72030, -49.28730) BPZ = 0.385 [0.171--3.930] type = 8.70 (SB2_B10 - SB1_B10) chisq2 = 0.69 ODDS = 0.04 z_cluster = 0.870