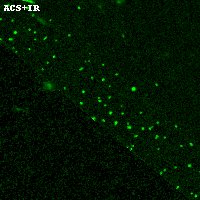
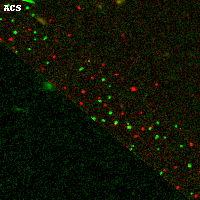
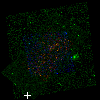
ACT0102-49 ACS+IR detection object #253
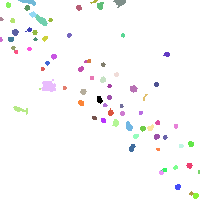
Color images and BPZ results
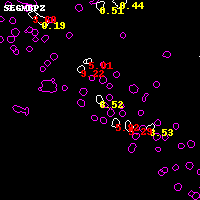
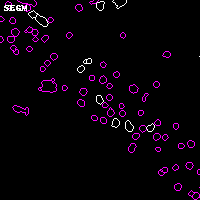
Catalog: 253.cat
Black segments are analyzed here. Roll mouse over color images to view segments.
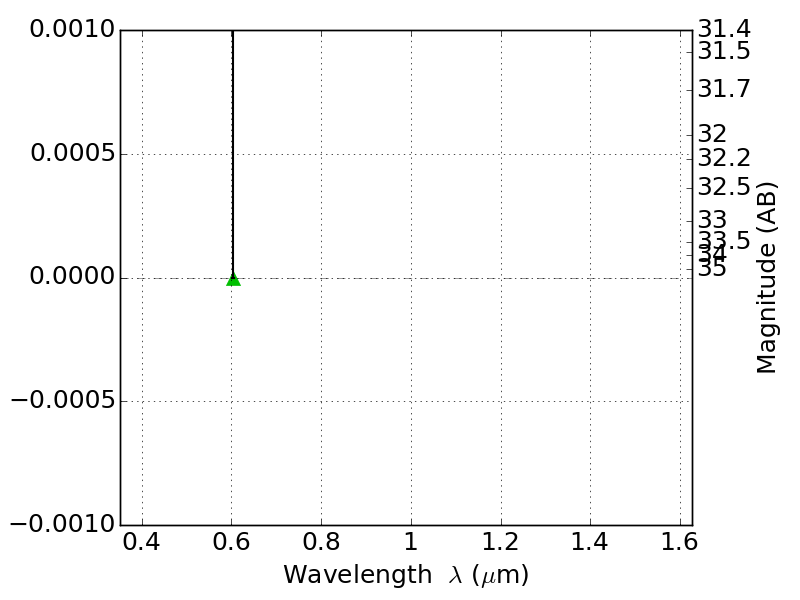
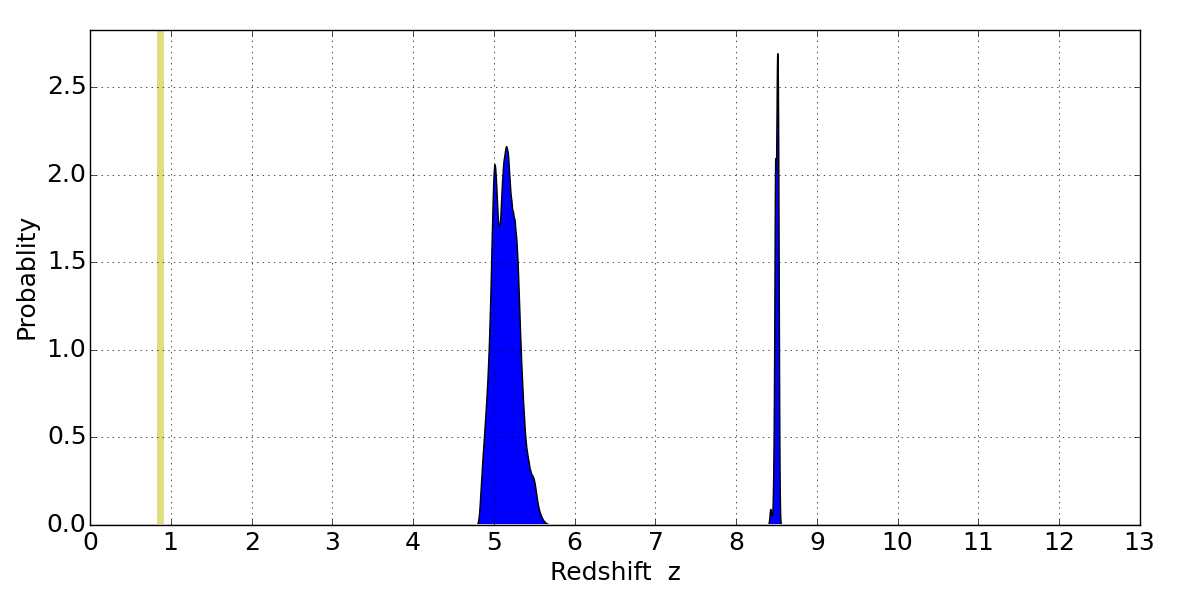
Best viewed in a wide browser window (1200 pixels or more). Download SED & P(z) plots to view larger versions.
In P(z) plots: Yellow lines mark the cluster redshift z = 0.870,
Object #253 x,y = (2236, 415) RA, Dec = (01:03:05.424, -49:18:56.88) = (15.77260, -49.31580) BPZ = 8.516 [4.896--8.526] type = 4.10 (Ell4_A_0 - ES0_B10) chisq2 = 0.00 ODDS = 0.14 z_cluster = 0.870