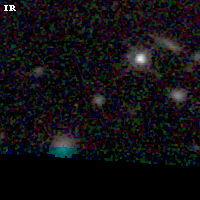
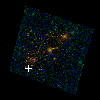
ABELLS295 ACS+IR detection object #5051
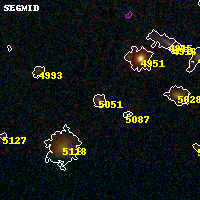
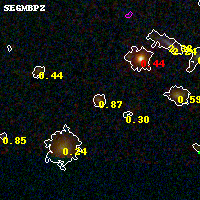
Color images and BPZ results
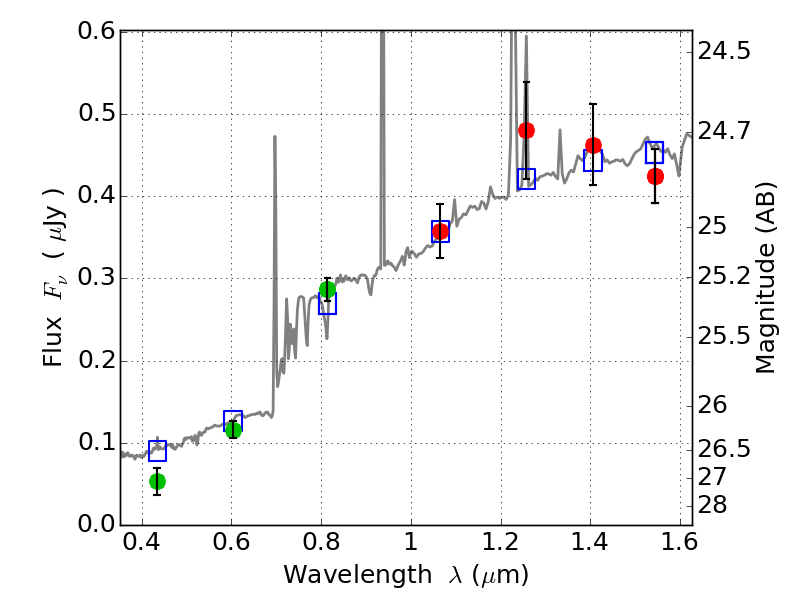
Catalog: 5051.cat
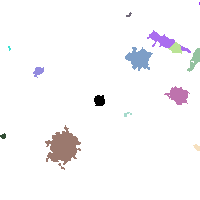
Black segments are analyzed here. Roll mouse over color images to view segments.
Best viewed in a wide browser window (1200 pixels or more). Download SED & P(z) plots to view larger versions.
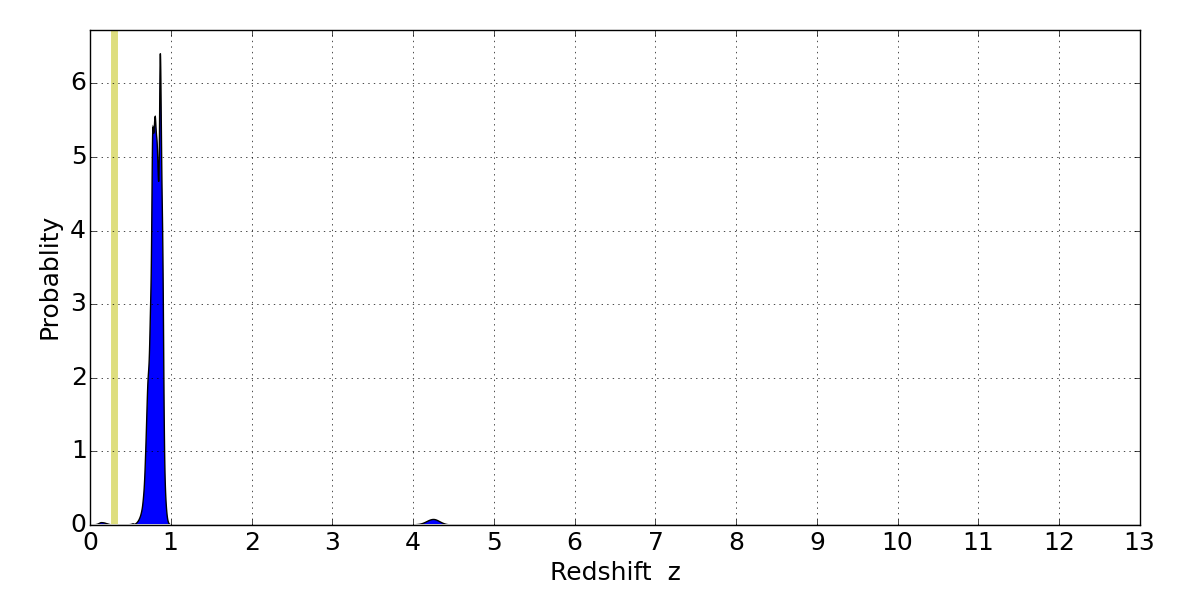
In P(z) plots: Yellow lines mark the cluster redshift z = 0.300,
Object #5051 x,y = (1440, 1613) RA, Dec = (02:45:36.576, -53:03:20.52) = (41.40240, -53.05570) BPZ = 0.871 [0.678--0.930] type = 8.20 (SB1_B10 - SB2_B10) chisq2 = 0.56 ODDS = 0.62 z_cluster = 0.300