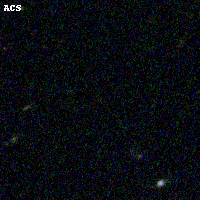
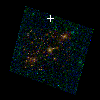
ABELLS295 ACS+IR detection object #505
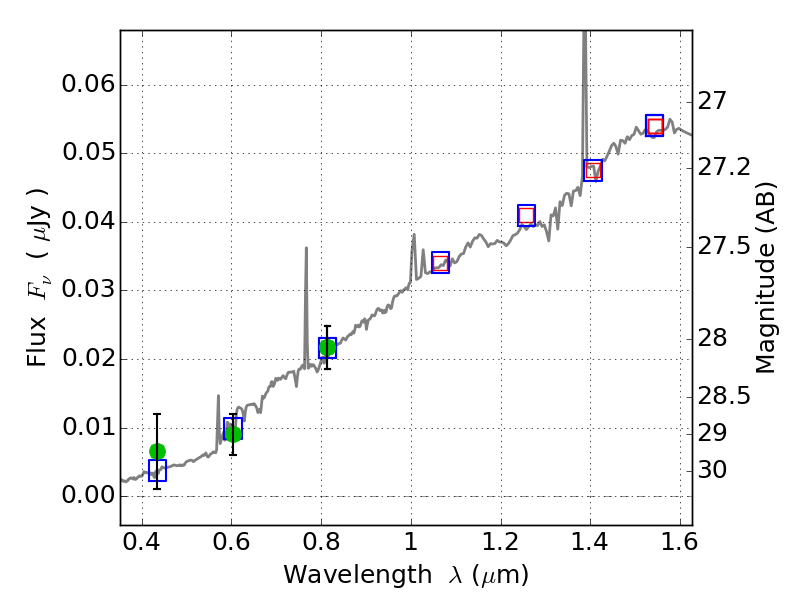
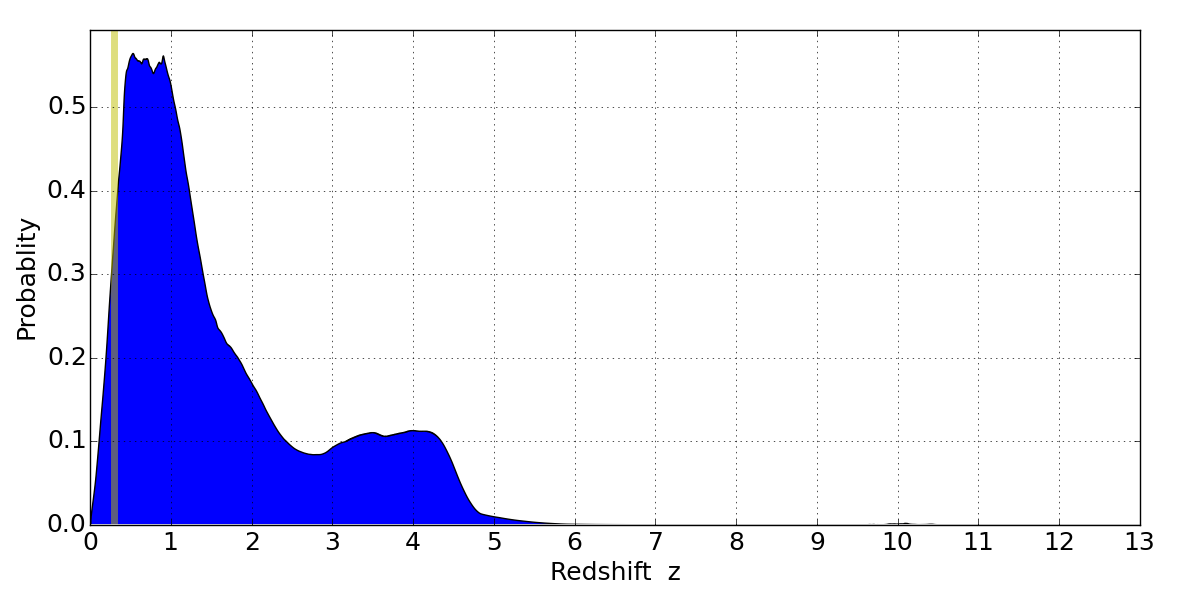
Color images and BPZ results
Catalog: 505.cat
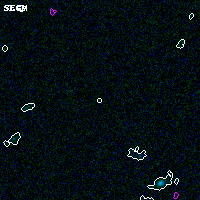
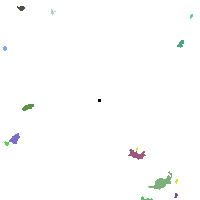
Black segments are analyzed here. Roll mouse over color images to view segments.
Best viewed in a wide browser window (1200 pixels or more). Download SED & P(z) plots to view larger versions.
In P(z) plots: Yellow lines mark the cluster redshift z = 0.300,
Object #505 x,y = (2529, 4129) RA, Dec = (02:45:29.328, -53:00:-49.32) = (41.37220, -53.01370) BPZ = 0.533 [0.229--4.433] type = 6.50 (Scd_B10 - Sbc_B10) chisq2 = 0.22 ODDS = 0.07 z_cluster = 0.300