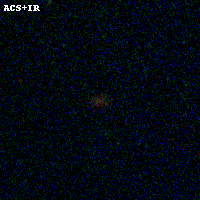
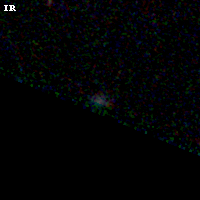
ABELL697 IR detection object #1
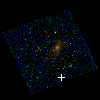
Color images and BPZ results
Catalog: 1.cat
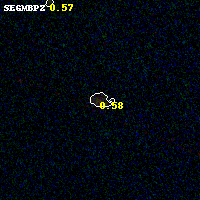
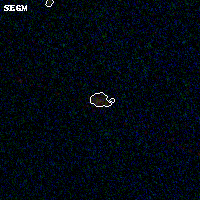
Black segments are analyzed here. Roll mouse over color images to view segments.
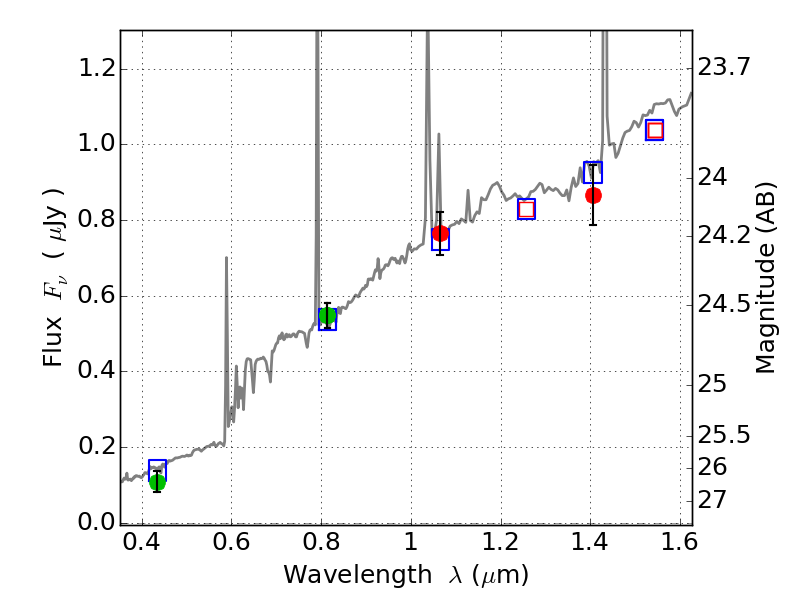
Best viewed in a wide browser window (1200 pixels or more). Download SED & P(z) plots to view larger versions.
In P(z) plots: Yellow lines mark the cluster redshift z = 0.282,
Object #1 x,y = (3064, 1182) RA, Dec = (08:42:56.424, 36:20:32.28) = (130.73510, 36.34230) BPZ = 0.576 [0.199--0.907] type = 7.50 (SB1_B10 - Scd_B10) chisq2 = 0.28 ODDS = 0.25 z_cluster = 0.282