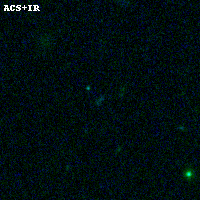
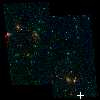
ABELL520 ACS+IR detection object #430
Color images and BPZ results
Catalog: 430.cat
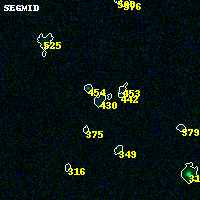
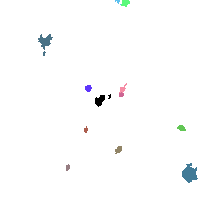
Black segments are analyzed here. Roll mouse over color images to view segments.
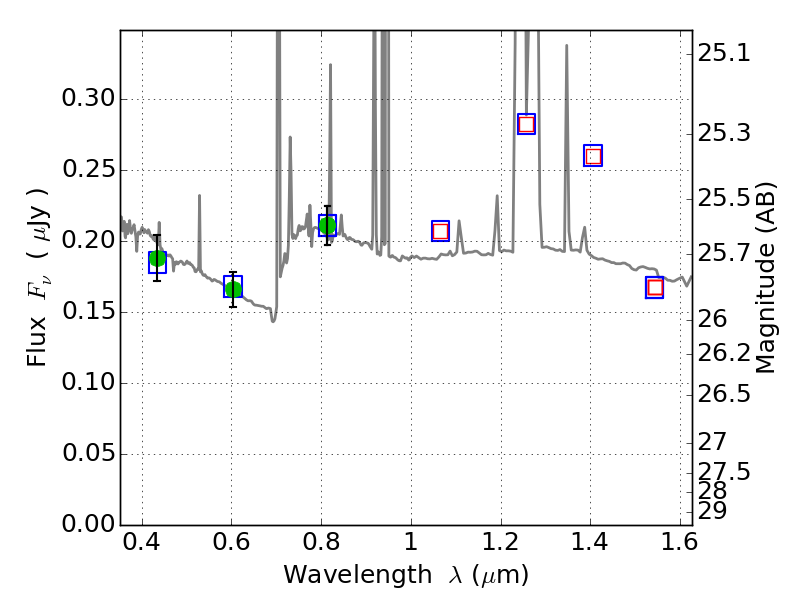
Best viewed in a wide browser window (1200 pixels or more). Download SED & P(z) plots to view larger versions.
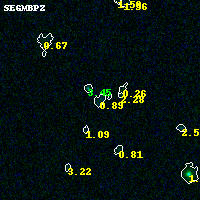
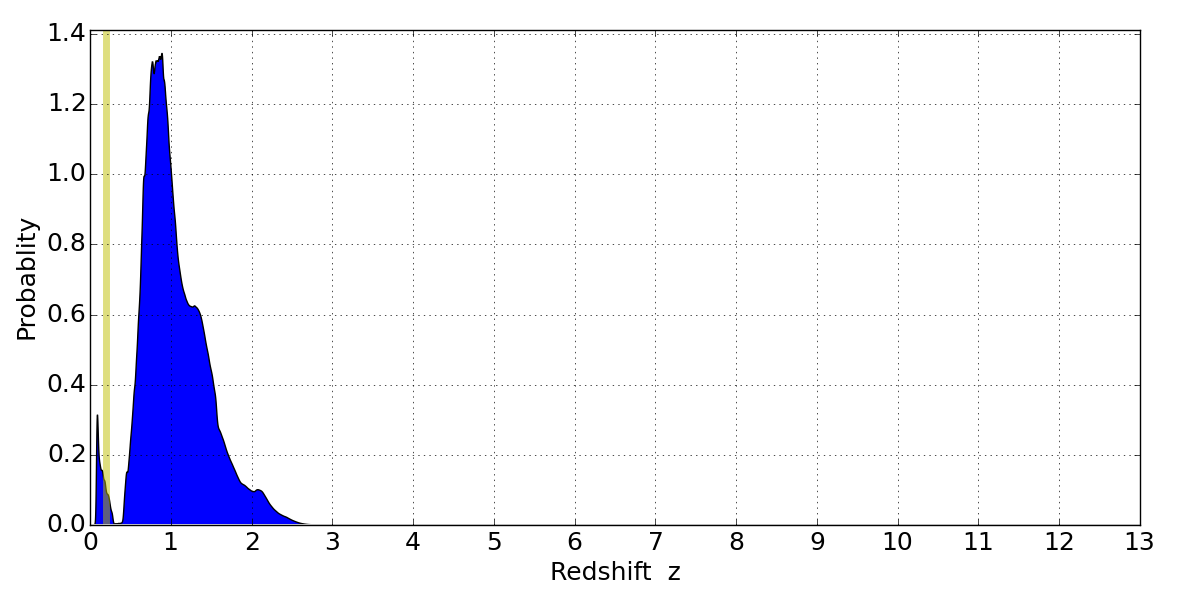
In P(z) plots: Yellow lines mark the cluster redshift z = 0.203,
Object #430 x,y = (6407, 451) RA, Dec = (04:53:59.832, 02:52:19.20) = (73.49930, 2.87200) BPZ = 0.892 [0.230--2.055] type = 10.40 (SB3_B10 - SB11_A_0_l) chisq2 = 0.02 ODDS = 0.20 z_cluster = 0.203