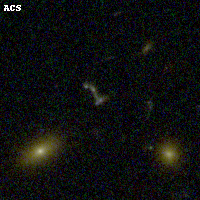
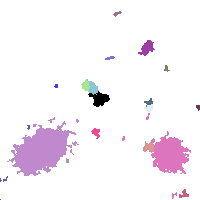
ABELL520 ACS+IR detection object #411
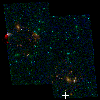
Color images and BPZ results
Catalog: 411.cat
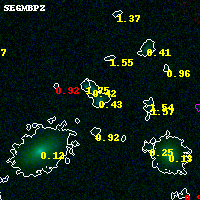
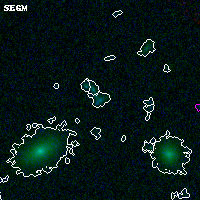
Black segments are analyzed here. Roll mouse over color images to view segments.
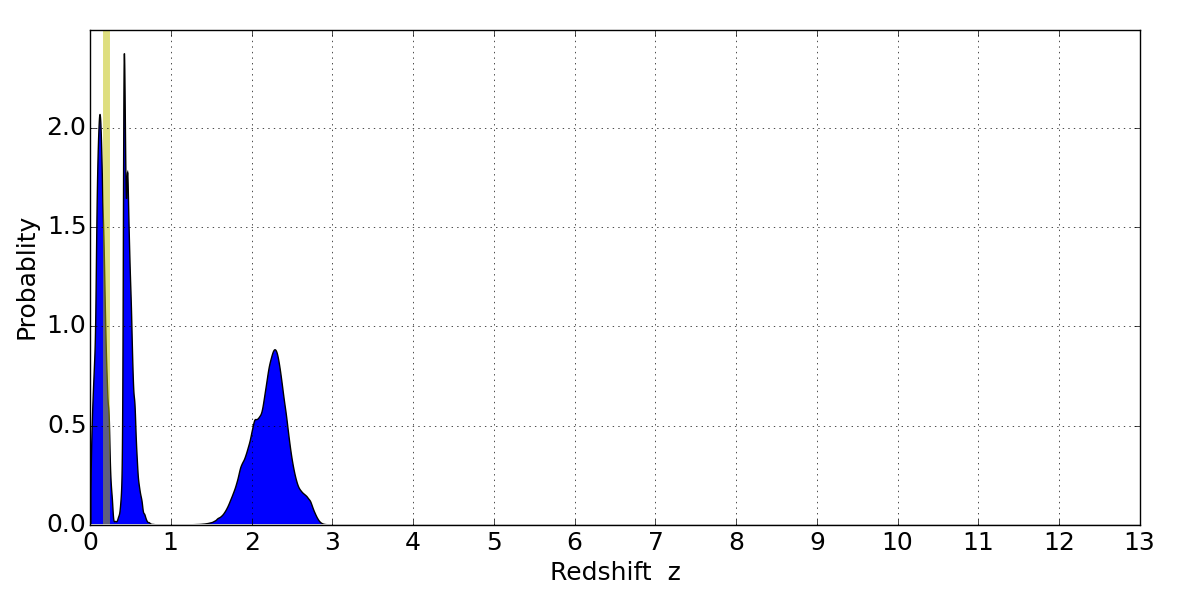
Best viewed in a wide browser window (1200 pixels or more). Download SED & P(z) plots to view larger versions.
In P(z) plots: Yellow lines mark the cluster redshift z = 0.203,
Object #411 x,y = (5250, 443) RA, Dec = (04:54:04.464, 02:52:18.84) = (73.51860, 2.87190) BPZ = 0.426 [0.055--2.613] type = 9.70 (SB3_B10 - SB2_B10) chisq2 = 0.06 ODDS = 0.15 z_cluster = 0.203