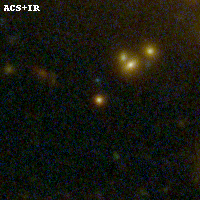
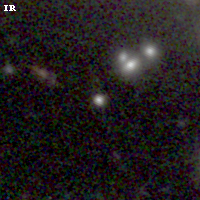
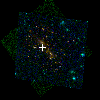
ABELL3192 IR detection object #501
Color images and BPZ results
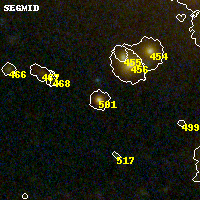
Catalog: 501.cat
Black segments are analyzed here. Roll mouse over color images to view segments.
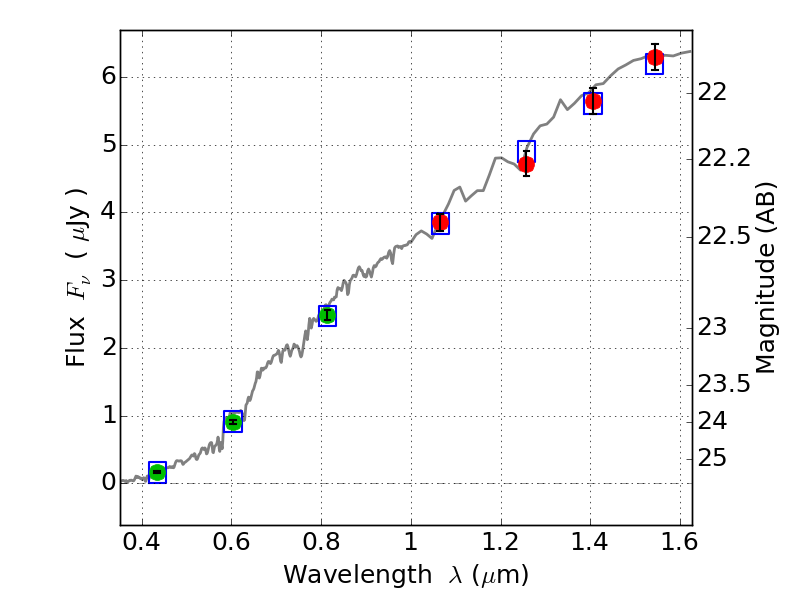
Best viewed in a wide browser window (1200 pixels or more). Download SED & P(z) plots to view larger versions.
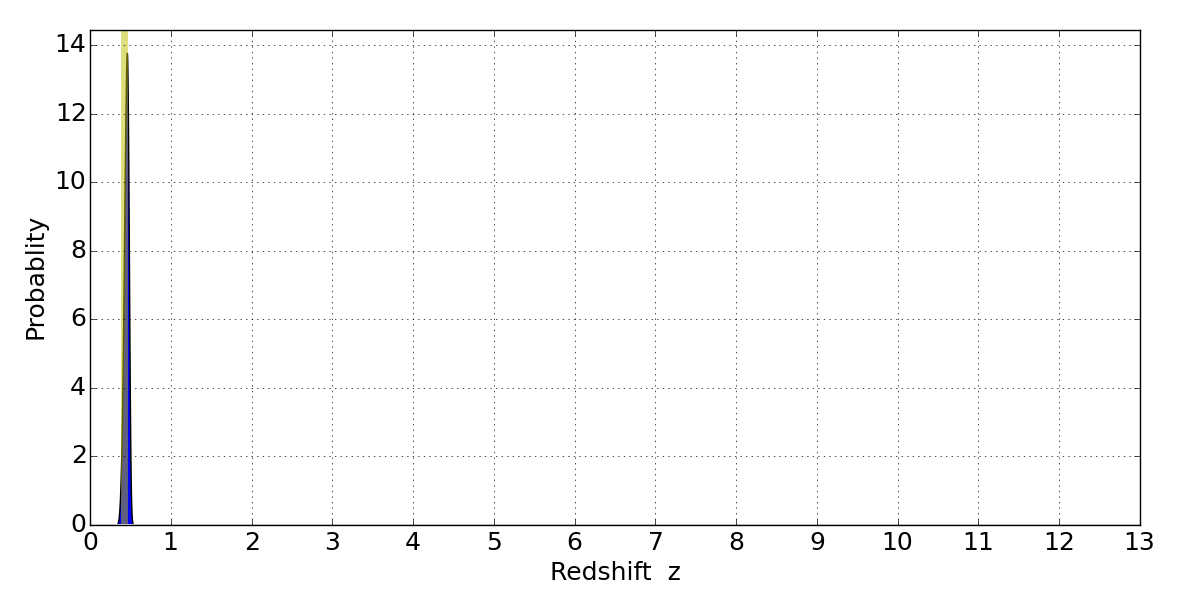
In P(z) plots: Yellow lines mark the cluster redshift z = 0.425,
Object #501 x,y = (2112, 2668) RA, Dec = (03:58:53.928, -29:55:44.76) = (59.72470, -29.92910) BPZ = 0.462 [0.389--0.503] type = 3.00 (Ell5_A_0) chisq2 = 0.06 ODDS = 0.94 z_cluster = 0.425