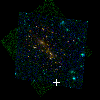
ABELL3192 ACS+IR detection object #5033
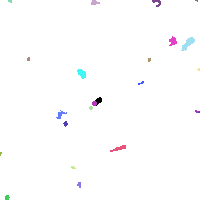
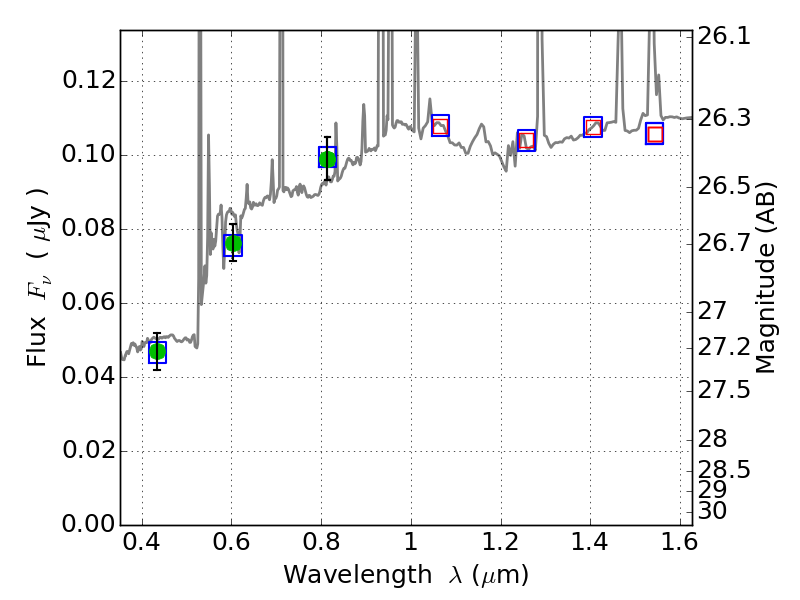
Color images and BPZ results
Catalog: 5033.cat
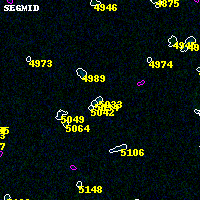
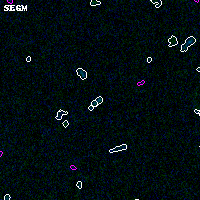
Black segments are analyzed here. Roll mouse over color images to view segments.
Best viewed in a wide browser window (1200 pixels or more). Download SED & P(z) plots to view larger versions.
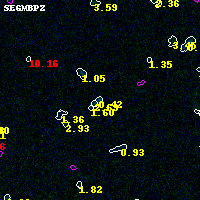
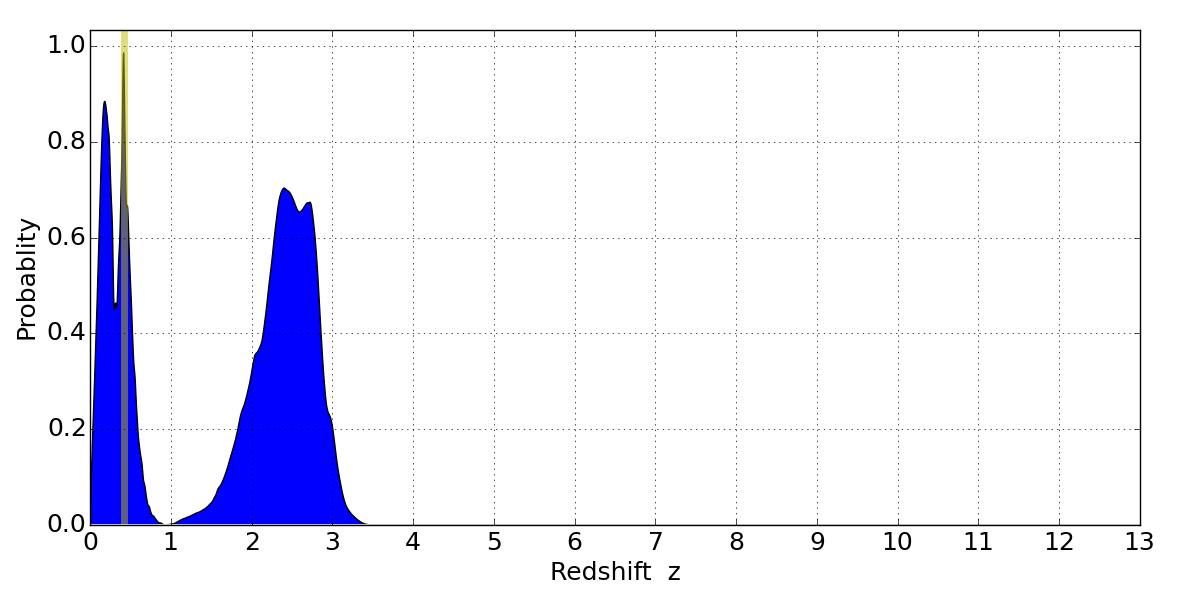
In P(z) plots: Yellow lines mark the cluster redshift z = 0.425,
Object #5033 x,y = (2835, 920) RA, Dec = (03:58:50.592, -29:57:29.52) = (59.71080, -29.95820) BPZ = 0.416 [0.096--2.989] type = 9.50 (SB3_B10 - SB2_B10) chisq2 = 0.01 ODDS = 0.09 z_cluster = 0.425