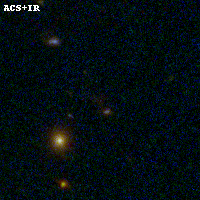
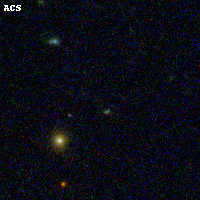
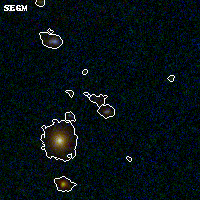
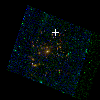
ABELL2537 IR detection object #60
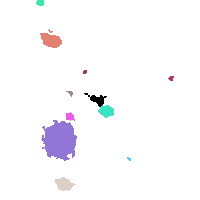
Color images and BPZ results
Catalog: 60.cat
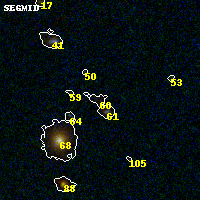
Black segments are analyzed here. Roll mouse over color images to view segments.
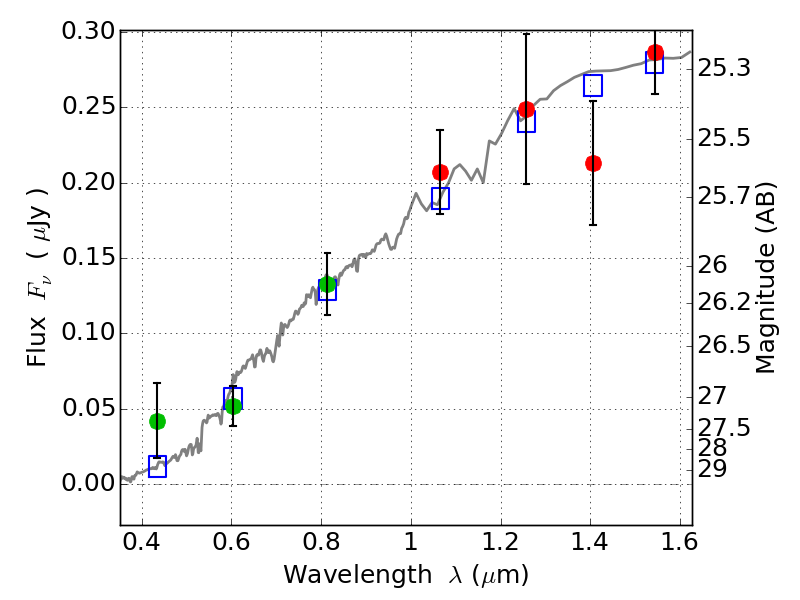
Best viewed in a wide browser window (1200 pixels or more). Download SED & P(z) plots to view larger versions.
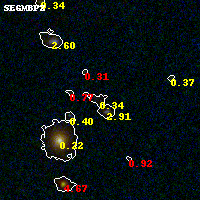
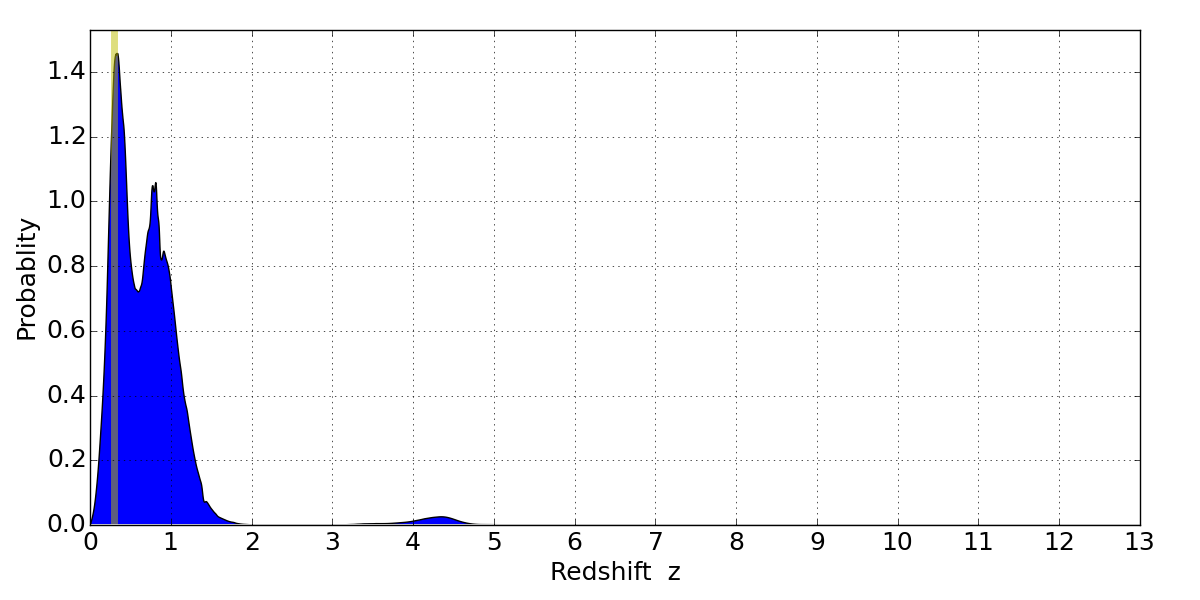
In P(z) plots: Yellow lines mark the cluster redshift z = 0.297,
Object #60 x,y = (2758, 3433) RA, Dec = (23:08:20.592, -2:10:32.52) = (347.08580, -2.17570) BPZ = 0.336 [0.165--1.485] type = 3.00 (Ell5_A_0) chisq2 = 0.67 ODDS = 0.15 z_cluster = 0.297