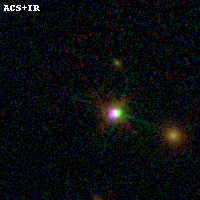
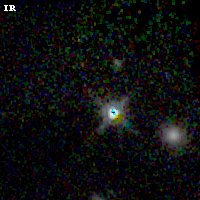
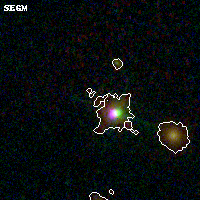
ABELL2537 IR detection object #10
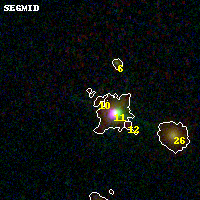
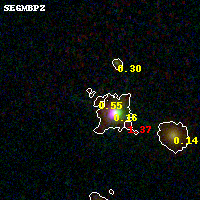
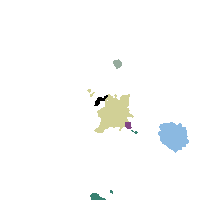
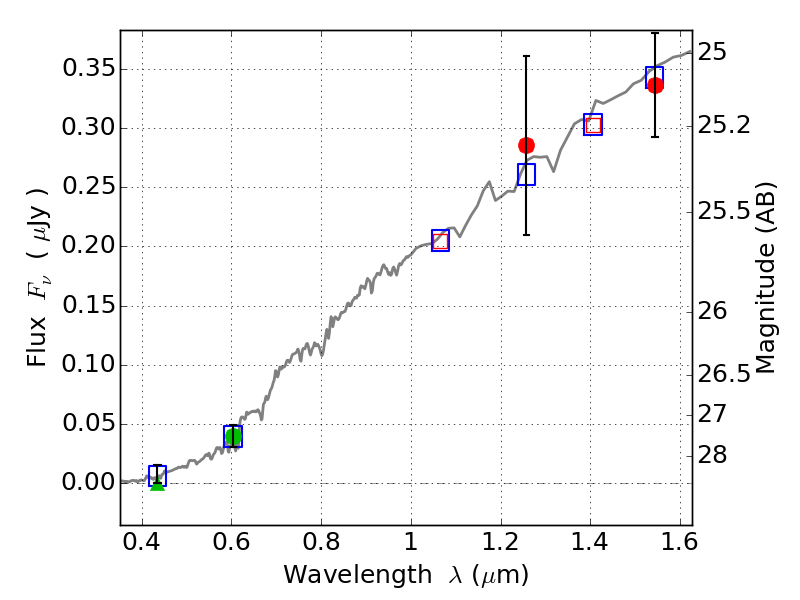
Color images and BPZ results
Catalog: 10.cat
Black segments are analyzed here. Roll mouse over color images to view segments.
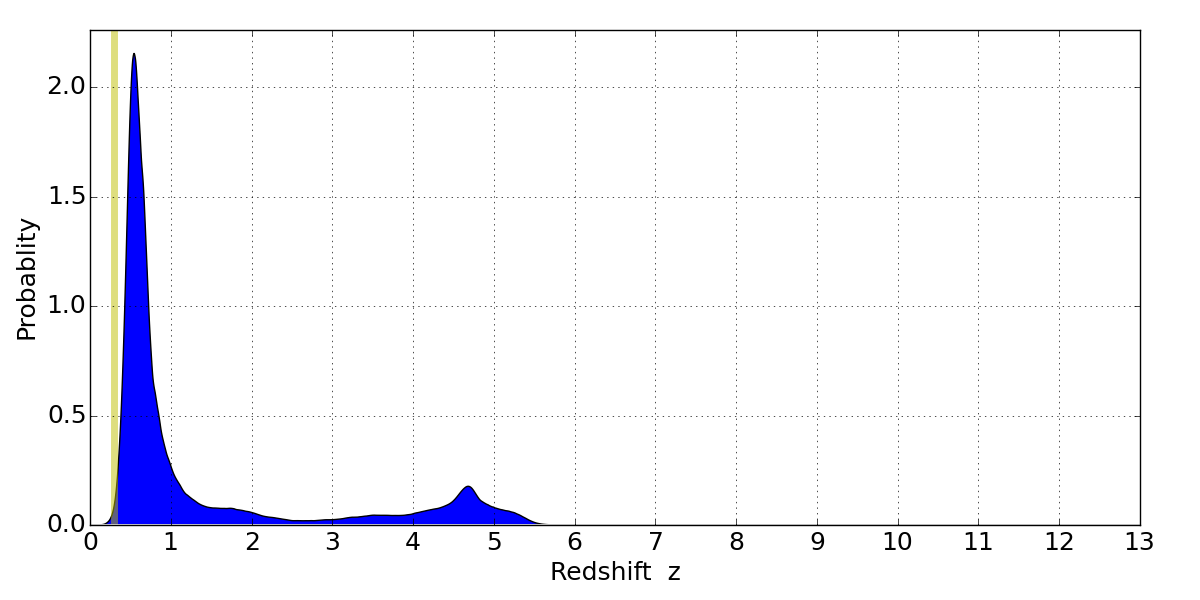
Best viewed in a wide browser window (1200 pixels or more). Download SED & P(z) plots to view larger versions.
In P(z) plots: Yellow lines mark the cluster redshift z = 0.297,
Object #10 x,y = (2947, 4379) RA, Dec = (23:08:18.960, -2:10:26.76) = (347.07900, -2.17410) BPZ = 0.546 [0.383--5.021] type = 3.00 (Ell5_A_0) chisq2 = 0.16 ODDS = 0.25 z_cluster = 0.297