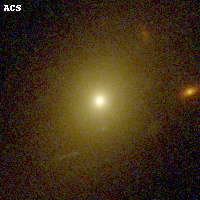
ABELL2163 IR detection object #1
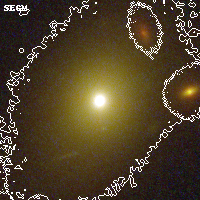
Color images and BPZ results
Catalog: 1.cat
Black segments are analyzed here. Roll mouse over color images to view segments.
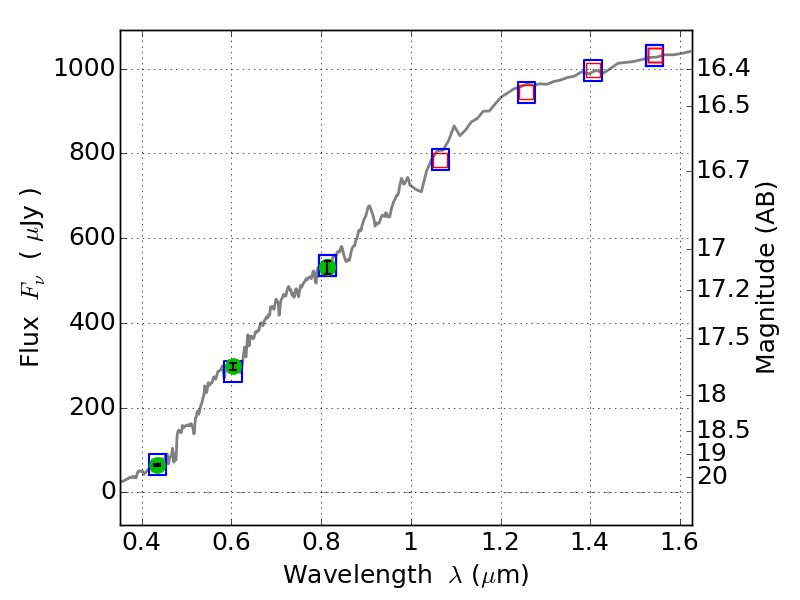
Best viewed in a wide browser window (1200 pixels or more). Download SED & P(z) plots to view larger versions.
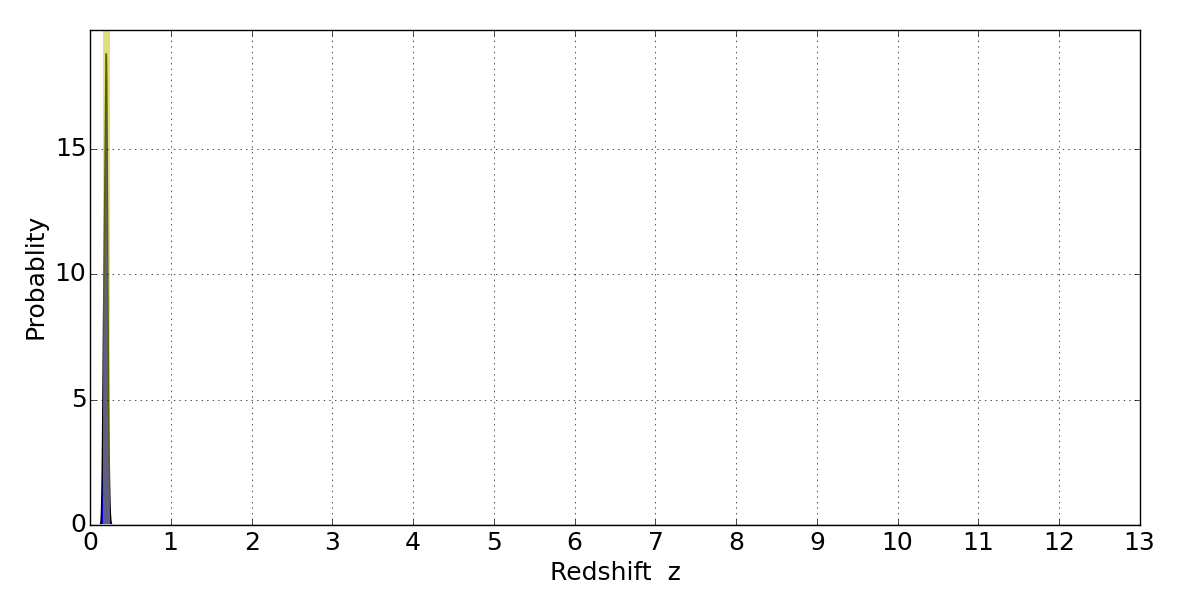
In P(z) plots: Yellow lines mark the cluster redshift z = 0.203,
Object #1 x,y = (4166, 1829) RA, Dec = (16:15:42.744, -6:10:35.04) = (243.92810, -6.17640) BPZ = 0.202 [0.154--0.237] type = 2.90 (Ell5_A_0 - Ell6_A_0) chisq2 = 0.02 ODDS = 0.98 z_cluster = 0.203