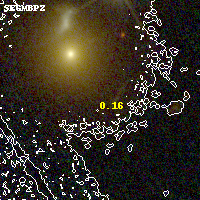
ABELL2163 ACS+IR detection object #1
Color images and BPZ results
Catalog: 1.cat
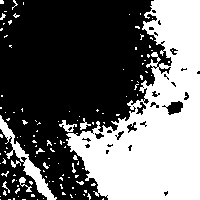
Black segments are analyzed here. Roll mouse over color images to view segments.
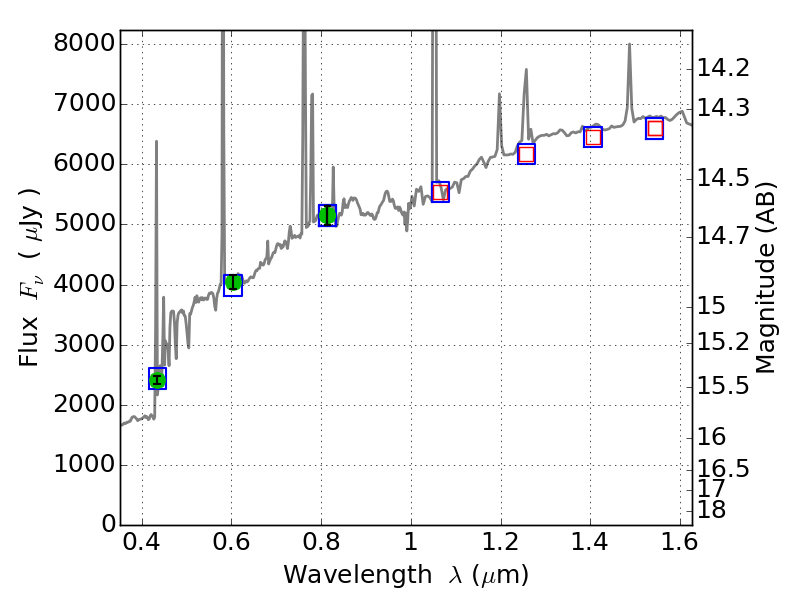
Best viewed in a wide browser window (1200 pixels or more). Download SED & P(z) plots to view larger versions.
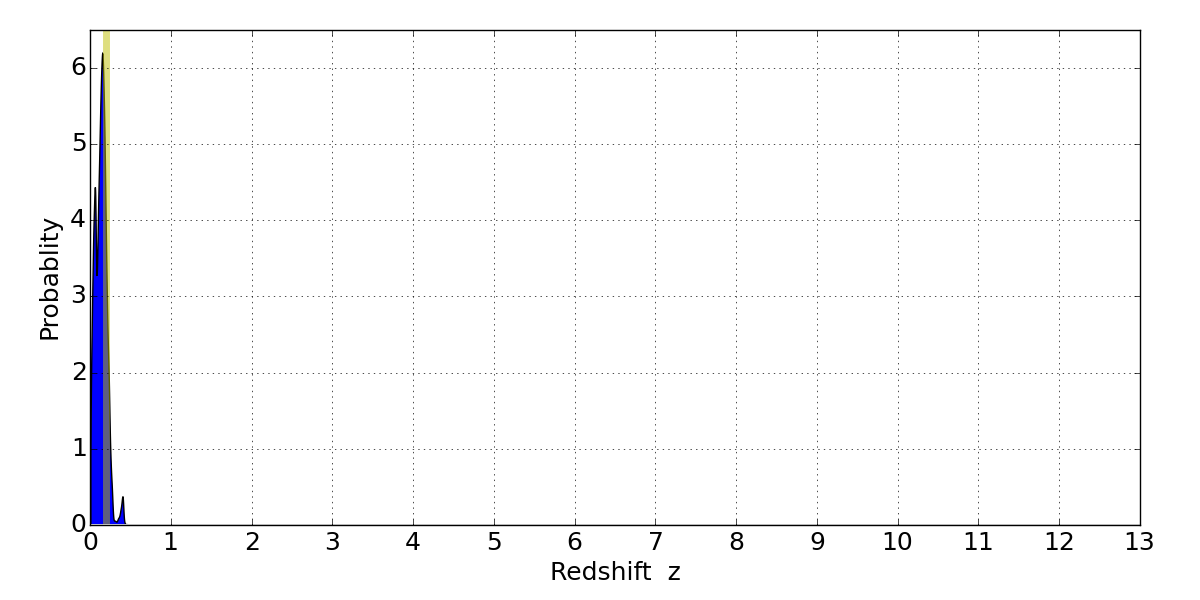
In P(z) plots: Yellow lines mark the cluster redshift z = 0.203,
Object #1 x,y = (3035, 4317) RA, Dec = (16:15:47.280, -6:08:05.64) = (243.94700, -6.13490) BPZ = 0.158 [0.023--0.274] type = 8.60 (SB2_B10 - SB1_B10) chisq2 = 0.01 ODDS = 0.50 z_cluster = 0.203